Download

1 / 30
300 likes | 455 Vues
Should genome sequencing of multiple oncogenes surplant V600 mutation testing by an FDA approved test ?. Omid Hamid MD Director, Melanoma Program Chief, Translational Research & Immunotherapy The Angeles Clinic and Research Institute. Delivering Rational, Affordable Cancer Care

E N D
Should genome sequencing of multiple oncogenes surplant V600 mutation testing by an FDA approved test ? Omid Hamid MD Director, Melanoma Program Chief, Translational Research & Immunotherapy The Angeles Clinic and Research Institute
Delivering Rational, Affordable Cancer Care in the 21st Century Omid Hamid MD Director, Melanoma Program Chief, Translational Research & Immunotherapy The Angeles Clinic and Research Institute
What is expected from this discussion ? “ Jane you ……. “
Background • Benefits of accelerating progress • ? Fundamental drivers of carcinogenesis • More effective, less toxic tx • The cost on treatment competes with availability of effective therapy • Few options
Where to begin ? • bcr/abl in APL • Ckit in GIST • BRAF in Melanoma • ALK & ROS in NSCLC
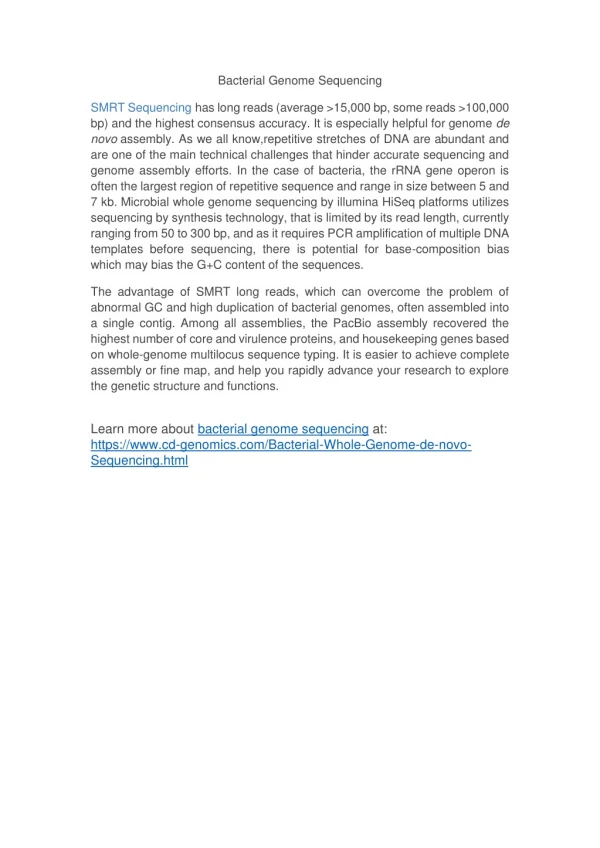
Deep sequencing > 200 oncogenes • Cost – $5,000 to 6,000 • Actionable genes
BRIM3: OS* (October 3, 2011, Cutoff†) 1.0 HR=0.62 (95% CI: 0.49-0.77) 0.9 0.8 0.7 0.6 OS, % 0.5 0.4 0.3 DTICmedian OS: 9.6 months Vemurafenib median OSa: 13.2 months 0.2 0.1 0 0 1 2 3 4 5 6 7 8 9 10 11 12 13 14 15 16 17 18 19 20 Time, Months Number of patients at risk: 338 337 305 336 274 335 242 326 215 313 191 299 169 280 150 259 122 245 101 223 79 181 62 147 46 112 31 86 22 54 15 35 6 17 4 10 1 3 0 0 DTIC Vemurafenib *Ad-hoc analysis for European Medicines Agency regulatory filing. †Patients on DTIC who received vemurafenib after the investigator assessment (by data and safety monitoring board recommendation; n=81) were censored at the date of crossover. aProjected median for ad-hoc analysis. Data on file. Genentech, Inc.
Main Points • BRIM Studies – central BRAF determination • Created a standard for community • No cost to patient/insurance • Led to randomized phase III studies with • Significant OS and PFS • Accrued in less than 1 year due to demand • Drug not available commercially
Rationale for Sorafenib in Melanoma • Induces apoptosis in B-Raf wild-type and mutant melanoma cell lines • Phase I/II trial of Sorafenib in combo with Carbo/Taxol • One CR, PR (26%) , clinical benefit (85%) • Median PFS of > 8 months
Sorafenib in Melanoma: PRISMPhase III Paclitaxel + Carboplatin ± Sorafenib RANDOMIZATION Carboplatin AUC 6 IV Day 1 Paclitaxel 225 mg/m2 IV Day 1 Sorafenib 400 mg po bid Days 2-19 Cycles repeated every 21 days Stratified by: AJCC stage: • Unresectable stage III • Stage IV – M1a, M1b • Stage IV – M1c ECOG PS: • 0 vs 1 Key Eligibility: • Progresses on DTIC/TMZ • No active brain Metastases • Measurable disease by RECIST Mandatory dose reduction after cycle 4 to paclitaxel 175 mg/m2 and carboplatin AUC 5 Carboplatin AUC 6 IV Day 1 Paclitaxel 225 mg/m2 IV Day 1 Placebo 2 tablets po bid Days 2-19 Cycles repeated every 21 days Primary endpoint: progression-free survival (by independent assessment) Secondary and tertiary endpoints: time to progression, objective response rate, duration of response, overall survival N=270 Agarwala SS, et al. Proc Am Soc Clin Oncol. 2007;25:474s. Abstract 8510.
0 14 29 43 57 71 Weeks From Randomization Phase III Carboplatin/Paclitaxel ± Sorafenib ORR 11% 10% Sorafenib + C/P (97 events) Median: 4.0 mo. Placebo + C/P (100 events) Median: 4.1 mo. 1.00 0.75 0.50 0.25 0.00 Probability of Progression-Free Survival Hazard Ratio = 0.91; P = 0.492 Agarwala SS, et al. Proc Am Soc Clin Oncol. 2007;25:474s. Abstract 8510.
Sorafenib + C/P (91 deaths) Median: 42 weeks (95% CI: 35, 46) Placebo + C/P (89 deaths) Median: 42 weeks (95% CI: 37, 54) 86 100 0 14 29 43 57 71 Weeks From Randomization PRISM: Overall Survival Hazard Ratio = 1.014; p = 0.924
Paclitaxel/Carboplatin ± Sorafenib in Advanced MelanomaE2603 Phase III Trial RANDOMIZE Arm A Carboplatin AUC 6 IV Day 1 Paclitaxel 225 mg/m2 IV Day 1 Placebo 2 tablets po bid Days 2-19 Q3W Stratified by: • AJCC Stage • ECOG PS • Prior Therapy Arm B Carboplatin AUC 6 IV Day 1 Paclitaxel 225 mg/m2 IV Day 1 Sorafenib 400 mg po bid Days 2-19 Q3W 800 patients with metastatic melanoma and no prior chemotherapy; primary endpoint - OS Carboplatin and paclitaxel with or without sorafenib in treating patients with unresectable stage III or stage IV melanoma. Available at: www.clinicaltrials.gov/ct/show/NCT0010019?order=1. Accessed September 17, 2007.
E2603: Efficacy Carboplatin/paclitaxelCarboplatin/paclitaxel & sorafenib Overall survival 11.3 mo. 11.1 mo. Progression-free 4.1 mo. 4.9 mo. survival Response rate 16% 18% p> 0.05 for all comparisons
Efficacy and safety of oral MEK162 in patients with locally advanced and unresectable or metastatic cutaneous melanoma harboringBRAFV600 or NRAS mutations BRAFV600 - mutant n = 41 pts MEK162 45 mg BID Patients with advanced cutaneous melanoma AJCC stage IIIB-IV NRAS or BRAF mutation WHO PS 0-2 No prior MEKi therapy Prior BRAF inhibitor permitted Prior therapy permitted NRAS-mutant n = 30 pts MEK162 45 mg BID Paolo A. Ascierto,* CarolaBerking, Sanjiv S. Agarwala, Dirk Schadendorf, Carla van Herpen, Paola Queirolo, Christian U. Blank, Axel Hauschild, J. Thaddeaus Beck, Angela Zubel, FaizNiazi, Simon Wandel, ReinhardDummer *National Cancer Institute, Naples Italy *as of 29 Feb 2012.
Best percentage change from baseline and best overall response (NRAS) 45 mg NRAS N=28* Progressive Disease (PD) Stable Disease (SD) Partial Response (PR) Unconfirmed PR *Patients with missing best % change from baseline and unknown overall response are not included. Ongoing pts
Is it actionable ? What is “actionable”? ERROR: Actionable = Druggable not always Actionable = Beneficial E2603/PRISM BEAM (bevacizumab) Temodar based on MGMT BRAF for lung/CRC/thyroid CD117 for ckit ??? MEKi for NRAS mut melanoma
Concerns • Off label use leading • Decreased enrollment to clinical trial mechanism • Lack of data • Excess toxicity with Questionable Benefit • Morbidity • Mortality • Cost • Right drug ?
Off label prescribing in oncology is a real part of care and substantial contributor to cost* Reinforced by the Compendia-based reimbursement mechanism* Rapidly evolving evidence/information without mechanism to make sense of it all* Need a strategy to define appropriate off-label use Key Messages Delivering Affordable Cancer Care in the 21st Century October 8, 2012 - October 9, 2012
Source: Bach PB. Limits on Medicare’s Ability to control rising spending on cancer Drugs. N Engl J Med 2009;360:626-633.
U.S. Health Care Spending In 2012, the U.S. will spend $2.80 TRILLION on Health Care GDP in 2011 Rank of Economy CHINA $7.30 trillion #2 JAPAN $5.87 trillion #3 GERMANY $3.58 trillion #4 FRANCE $2.78 trillion #5 BRAZIL $2.49 trillion #6 UK $2.42 trillion #7
Cost of Healthcare and Cancer Care Healthcare costs accounted for 18% of GDP in 2010 Total cost of cancer in 2006: $284.4 billion (in 2011$) Direct medical cost: $123.9 billion Indirect (morbidity + mortality) cost $160.5 billion Total medical costs of cancer accounts for 5% of all health care expenditures 10% of the Medicare expenditures 1% of all payor’s patients Source: (1) Cancer Trends Progress Report – 2009/2010 Update, National Cancer Institute, http://progressreport.cancer.gov.
US Spending vs. Other Countries * Purchasing power parity. ** Estimated Spending According to Wealth. Source: Organization for Economic Co-operation and Development (OECD)
Rising costs and Stagnant wages “Medicaid and other health-care expenses are predicted to grow to as much as 40% of the state budget by 2015. That will force the state to cut higher education funding because there are few other options. ... It certainly seems to be on a collision course.” John Arnold, Director of the Arizona Office of Strategic Planning and Budgeting “Medicare and Medicaid will rise from 4.5% of the economy today to 20% of the economy by 2050. This is the central long-term fiscal challenge facing the United States, period.” Peter Orszag, while director of the Congressional Budget Office
Over the last 30 years: • Health insurance premiums increased by 300% after inflation. • Corporate profits increased 200% after taxes. • Net worker income in private industries declined by 4%. Source: Emanuel and Fuchs. Who Really Pays for Health Care? JAMA. 2008
Responsibility to Practice Effective and Efficient Health CareAmerican College of Physicians Ethics Manual, Sixth Edition “Physicians have a responsibility to practice effective and efficient health care and to use health care resources responsibly. Parsimonious care that utilizes the most efficient means to effectively diagnose a condition and treat a patient respects the need to use resources wisely…”
Conduct thoughtful pragmatic trials with comparators whenever possible Collect the data about what is happening in real practice – …….and learn from it