Download
1 / 1
10 likes | 179 Vues
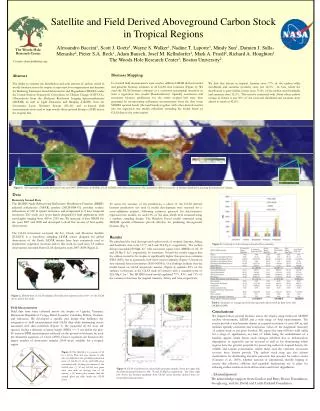
Sevilleta. Arizona. Jornada. (a). New Mexico. Aboveground Biomass. >50.0. 0.00. 6.70. Tons/acre. Estimated Biomass (tons/acre). >110.0. 0.00. 15.0. Mg ha -1. Fig. 6: Regional Mean Canopy Height. Mean Canopy Height. Fig. 7: Regional Forest Crown Cover. (b). >20.00. 1.00.

E N D
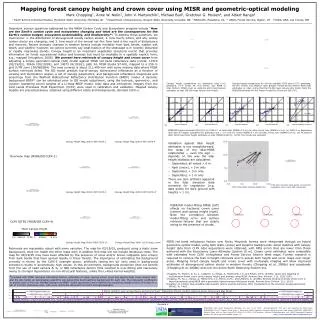
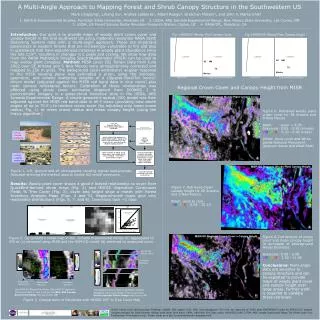
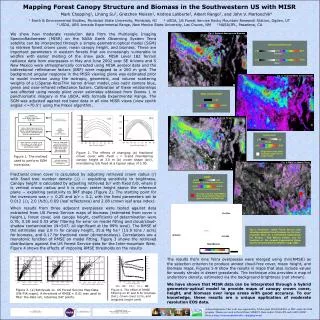
Sevilleta Arizona Jornada (a) New Mexico Aboveground Biomass >50.0 0.00 6.70 Tons/acre Estimated Biomass (tons/acre) >110.0 0.00 15.0 Mg ha-1 Fig. 6: Regional Mean Canopy Height Mean Canopy Height Fig. 7: Regional Forest Crown Cover (b) >20.00 1.00 meters < 1.00 Crown Cover < 6 > 60 0.30 0.90 Forest 50 km Figure 2. The effects of changing (a) fractional crown cover with fixed = 0.and maintaining canopy height at 3.0 m (b) crown shape (b/r), maintaining h/b fixed at a typical value of 2.00. Bright white areas show anomalies (high error on model fitting) Figure 1. The method used to perform SGM inversions. RMSE 0.00 0.29 Accepted (includes almost all forest) Shrubs 0.019 >0.140 Rejected (mostly desert grassland) The large area with high RMSE is White Sands National Monument (gypsum dunes and alkali flats) Fig. 8: RMSE on Model Fitting <0.003 0.016 Fig 9: Reference: USDA Forest Service map showing estimated forest biomass for the Inter-mountain West on a hill-shaded background; the Arizona / New Mexico border; and the locations of the Jornada Experimental Range and the Sevilleta National Wildlife refuge (NM). (b) (c) (a) Figure 3. (a) Retrievals vs. US Forest Service Map Data (IW-FIA maps). A threshold of RMSE < 0.01 was used to filter the data set, retaining 547 points. Figure 4. The effect of RMSE filtering on R2 and N for biomass (bio), crown cover (crn), and weighted height (wht) Mapping Forest Canopy Structure and Biomass in the Southwestern US with MISR Mark Chopping1, Lihong Su1, Gretchen Moisen2, Andrea Laliberte3, Albert Rango3, and John V. Martonchik4 1 Earth & Environmental Studies, Montclair State University, Montclair, NJ 2 USDA, US Forest Service Rocky Mountain Research Station, Ogden, UT 3 USDA, ARS Jornada Experimental Range, New Mexico State University, Las Cruces, NM 4 NASA/JPL, Pasadena, CA We show how moderate resolution data from the Multiangle Imaging SpectroRadiometer (MISR) on the NASA Earth Observing System Terra satellite can be interpreted through a simple geometric-optical model (SGM) to retrieve forest crown cover, mean canopy height, and biomass. These are important parameters in western forests that are increasingly vulnerable to wildfire with earlier melting of the snow pack. MISR Level 1B2 Terrain radiance data from overpasses in May and June 2002 over SE Arizona and S New Mexico were atmospherically corrected using MISR aerosol data and the bidirectional reflectance factors (BRF) were mapped to a 250 m grid. The background angular response in the MISR viewing plane was estimated prior to model inversion using the isotropic, geometric, and volume scattering weights of a LiSparse-RossThin kernel driven model, plus nadir camera blue, green and near-infrared reflectance factors. Calibration of these relationships was effected using woody plant cover estimates obtained from Ikonos 1 m panchromatic imagery in the USDA, ARS Jornada Experimental Range. The SGM was adjusted against red band data in all nine MISR views (view zenith angles <=70.5°) using the Praxis algorithm. Fig. 5: Regional Aboveground Biomass Fractional crown cover is calculated by adjusting retrieved crown radius (r) with fixed tree number density () -- exploiting sensitivity to brightness. Canopy height is calculated by adjusting retrieved b/r with fixed h/b, where b is vertical crown radius and h is crown center height above the reference plane -- exploiting sensitivity to BRF shape (Figure 2). The starting point for the inversions was r = 0.25 and b/r = 0.2, with the fixed parameters set to 0.012 (), 2.0 (h/b), 0.09 (leaf reflectance) and 2.08 (crown leaf area index). When results from three adjacent overpasses were tested against data extracted from US Forest Service maps of biomass (estimated from cover x height.), forest cover, and canopy height, coefficients of determination were 0.76, 0.58 and 0.53 after filtering for error on model fitting and cloud/cloud-shadow contamination (N=547; all significant at the 99% level). The RMSE of the estimates was 2.8 m for canopy height, 35.6 Mg ha-1 (15.9 tons / acre) for biomass, and 0.17 for fractional cover (dimensionless). Correlations are a monotonic function of RMSE on model fitting.Figure 3 shows the retrieved distributions against the US Forest Service data for the Inter-mountain West. Figure 4 shows the effects of imposing RMSE thresholds on the results. The results from nine Terra overpasses were merged using min(RMSE) as the selection criterion to produce almost cloud-free cover, mean height, and biomass maps. Figures 5-8 show the results in maps that also include values for woody shrubs in desert grasslands. The technique also provides a map of understory density, estimated via the background brightness (not shown). We have shown that MISR data can be interpreted through a hybrid geometric-optical model to provide maps of canopy crown cover, height, and biomass over large areas with good accuracy. To our knowledge, these results are a unique application of moderate resolution EOS data. Acknowledgments: This work was supported by NASA grant NNG04GK91G to MJC under the EOS program. Thanks are owed to David Diner, MISR PI. Data credits: NASA/JPL and LARC/ASDC. More at http://csam.montclair.edu/~chopping/wood/