Download
1 / 61
610 likes | 632 Vues
Learn how the luminosity of a star is measured by considering its distance and brightness, and discover the methods for measuring stellar temperatures and masses. Explore the significance of the Hertzsprung-Russell diagram and the main sequence in understanding the properties and lifetimes of stars.

E N D
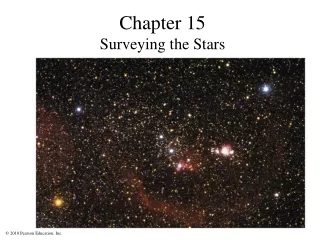
The brightness of a star depends on both distance and luminosity.
Luminosity: Amount of power a star radiates (energy per second = watts) Apparent brightness: Amount of starlight that reaches Earth (energy per second per square meter)
The amount of luminosity passing through each sphere is the same. Area of sphere: 4 (radius)2 Divide luminosity by area to get brightness.
The relationship between apparent brightness and luminosity depends on distance: Luminosity Brightness = 4 (distance)2 We can determine a star’s luminosity if we can measure its distance and apparent brightness: Luminosity = 4 (distance)2 (brightness)
p = parallax angle 1 d (in parsecs) = p (in arcseconds) 1 d (in light-years) = 3.26 p (in arcseconds) Parallax and Distance
Most luminous stars: 106LSun Least luminous stars: 10–4LSun (LSun is luminosity of Sun)
Every object emits thermal radiation with a spectrum that depends on its temperature.
An object of fixed size grows more luminous as its temperature rises.
Properties of Thermal Radiation Hotter objects emit more light per unit area at all frequencies. Hotter objects emit photons with a higher average energy.
Hottest stars: 50,000 K Coolest stars: 3000 K (Sun’s surface is 5800 K.)
Absorption lines in star’s spectrum tell us its ionization level.
Lines in a star’s spectrum correspond to a spectral type that reveals its temperature. (Hottest) O B A F G K M (Coolest)
Remembering Spectral Types (Hottest) O B A F G K M (Coolest) • Oh, Be A Fine Girl/Guy, Kiss Me • Only Boys Accepting Feminism Get Kissed Meaningfully
Pioneers of Stellar Classification • Annie Jump Cannon and the “calculators” at Harvard laid the foundation of modern stellar classification.
How do we measure stellar masses? Insert TCP 6e Figure 15.7 unannotated
Types of Binary Star Systems • Visual binary • Eclipsing binary • Spectroscopic binary About half of all stars are in binary systems.
Visual Binary We can directly observe the orbital motions of these stars.
Eclipsing Binary We can measure periodic eclipses.
Spectroscopic Binary We determine the orbit by measuring Doppler shifts.
We measure mass using gravity. Direct mass measurements are possible only for stars in binary star systems. p = period a = average separation 42 G (M1 + M2) p2 = a3
Need two out of three observables to measure mass: • Orbital period (p) • Orbital separation (a or r = radius) • Orbital velocity (v) For circular orbits, v = 2r/p. v r M
Most massive stars: 100MSun Least massive stars: 0.08MSun (MSun is the mass of the Sun.)
An H-R diagram plots the luminosity and temperature of stars. Luminosity Temperature
Most stars fall somewhere on the main sequence of the H-R diagram.
Stars with lower T and higher L than main-sequence stars must have larger radii. These stars are called giants and supergiants.
Stars with higher T and lower L than main-sequence stars must have smaller radii. These stars are called white dwarfs.
A star’s full classification includes spectral type (line identities) and luminosity class (line shapes, related to the size of the star): I - supergiant II - bright giant III - giant IV - subgiant V - main sequence Examples: Sun - G2 V Sirius - A1 V Proxima Centauri - M5.5 V Betelgeuse - M2 I
Temperature H-R diagram depicts: Temperature Color Spectral type Luminosity Radius Luminosity
Main-sequence stars are fusing hydrogen into helium in their cores like the Sun. Luminous main-sequence stars are hot (blue). Less luminous ones are cooler (yellow or red).
The mass of a normal, hydrogen-burning star determines its luminosity and spectral type.
Core pressure and temperature of a higher-mass star need to be larger in order to balance gravity. Higher core temperature boosts fusion rate, leading to larger luminosity.
Stellar Properties Review Luminosity: from brightness and distance 10–4LSun–106LSun Temperature: from color and spectral type 3000 K–50,000 K Mass: from period (p) and average separation (a) of binary star orbit 0.08MSun – 100MSun
Stellar Properties Review Luminosity: from brightness and distance 10–4LSun–106LSun Temperature: from color and spectral type 3000 K–50,000 K Mass: from period (p) and average separation (a) of binary star orbit 0.08MSun–100MSun (0.08MSun) (100MSun) (0.08MSun) (100MSun)
Mass and Lifetime Sun’s life expectancy: 10 billion years
Mass and Lifetime Until core hydrogen (10% of total) is used up Sun’s life expectancy: 10 billion years
Mass and Lifetime Until core hydrogen (10% of total) is used up Sun’s life expectancy: 10 billion years Life expectancy of 10MSun star: 10 times as much fuel, uses it 104 times as fast 10 million years ~ 10 billion years 10/104
Mass and Lifetime Until core hydrogen (10% of total) is used up Sun’s life expectancy: 10 billion years Life expectancy of 10MSun star: 10 times as much fuel, uses it 104 times as fast 10 million years ~ 10 billion years 10/104 Life expectancy of 0.1MSun star: 0.1 times as much fuel, uses it 0.01 times as fast 100 billion years ~ 10 billion years 0.1/0.01
Main-Sequence Star Summary • High-Mass Star: • High luminosity • Short-lived • Larger radius • Blue • Low-Mass Star: • Low luminosity • Long-lived • Small radius • Red
Off the Main Sequence • Stellar properties depend on both mass and age: Those that have finished fusing H to He in their cores are no longer on the main sequence. • All stars become larger and redder after exhausting their core hydrogen: giants and supergiants. • Most stars end up small and white after fusion has ceased: white dwarfs.