Download
1 / 81
810 likes | 834 Vues
Delve into measuring stars' luminosities, temperatures, and masses - key factors in understanding stellar properties and classifications. Learn about the inverse square law, parallax method, spectral types, and more in stellar astronomy. Unravel mysteries of stars through scientific methods.

E N D
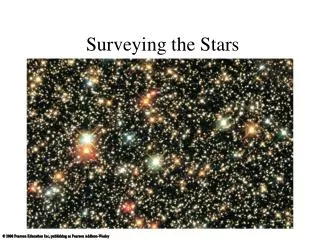
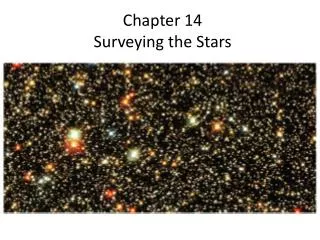
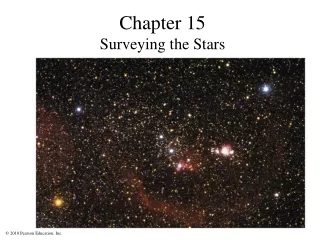
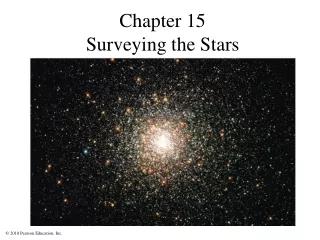
Properties of Stars • Our goals for learning • How do we measure stellar luminosities? • How do we measure stellar temperatures? • How do we measure stellar masses?
The brightness of a star depends on both distance and luminosity
Light and Distance • Light spreads with distance, expanding outward in a sphere • The number of photons passing through each sphere is the same, but get spread over a larger area • Thus light gets fainter with distance
To find the difference- Area of sphere: 4π (radius)2 Divide luminosity by area to get brightness The “Inverse square” law
Luminosity: Amount of power a star radiates (energy per second = Watts) Apparent brightness: Amount of starlight that reaches Earth (energy per second per square meter)
The relationship between apparent brightness and luminosity depends on distance: Luminosity Brightness = 4 (distance)2 We can determine a star’s luminosity if we can measure its distance and apparent brightness: Luminosity = 4 (distance)2 (brightness)
Apparent Magnitude(how bright does an object seem?) • Magnitude scale 1st developed by Hipparchus to compare the different brightness of stars • Brightest stars = 1 • Dimmest stars = 6 (designed before invention of telescopes, so only naked eye observations initially possible)
Distance Measuring by Parallax Parallax is the apparent shift in position of a nearby object against a background of more distant objects
Stellar Parallax: positions of nearest stars appear to shift as Earth orbits Sun
The amount of shift detected, depends on the distance to the stars
Parallax and Distance Use right-angled triangles to get distance
The Sun’s NeighborhoodThe distance to these stars was measured by parallax
Once we know the distance to stars by parallax, we can compensate for the drop in light levels caused by distance. • We can then see the difference in light levels caused by differing power output Most luminous stars: 106 LSun Least luminous stars: 10-4 LSun (LSun= luminosity of Sun)
A star can be classified by 'luminosity class' (line shapes, related to the size of the star) More luminous stars = more surface area = larger star I - supergiant II - bright giant III - giant IV - subgiant V - main sequence
Every object emits thermal radiation with a spectrum that depends on its temperature
Properties of Thermal Radiation • Hotter objects emit more light per unit area at all frequencies. • Hotter objects emit photons with a higher average energy.
Hottest stars: 50,000 K Coolest stars: 3,000 K (Sun’s surface is 5,800 K)
106 K Level of ionization also reveals a star’s temperature 105 K Ionized Gas (Plasma) 104 K 103 K Neutral Gas Molecules 102 K 10 K Solid
Absorption lines in star’s spectrum tell us ionization level
Lines in a star’s spectrum correspond to a spectral type that reveals its temperature (Hottest) O B A F G K M (Coolest)
Pioneers of Stellar Classification • Annie Jump Cannon and the “calculators” at Harvard laid the foundation of modern stellar classification.
Remembering Spectral Types (Hottest) O B A F G K M (Coolest) • Oh, Be A Fine Girl, Kiss Me • Only Boys Accepting Feminism Get Kissed Meaningfully
Remembering Spectral Types (Hottest) O B A F G K M (Coolest) The letter types also get sub-divided further by numbers 0-9 0=hottest stars within the spectral type 9= coolest stars within the spectral type. Our Sun, Capella A and Tau Ceti are all G type stars. Capella A is a G0 , the Sun is a G2, and Tau Ceti is a G8
A star’s full classification includes spectral type (line identities) AND luminosity class (line shapes, related to the size of the star): Examples: Sun - G2 V Sirius - A1 V Proxima Centauri - M5.5 V Betelgeuse - M2 I
The orbit of a binary star system depends on strength of gravity • The gravity between those stars depend on their masses • This means we can use Newton’s and Kepler’s laws to calculate the stars’ mass: About half of all stars are in binary systems!
Most massive stars: 100 MSun Least massive stars: 0.08 MSun (MSun is the mass of the Sun)
What have we learned? • How do we measure stellar luminosities? • If we measure a star’s apparent brightness and distance, we can compute its luminosity with the inverse square law for light • Parallax tells us distances to the nearest stars • How do we measure stellar temperatures? • A star’s color and spectral type both reflect its temperature
What have we learned? • How do we measure stellar masses? • Newton’s version of Kepler’s third law tells us the total mass of a binary system, if we can measure the orbital period (p) and average orbital separation of the system (a)
Patterns among Stars • Our goals for learning • What is a Hertzsprung-Russell diagram? • What is the significance of the main sequence? • What are giants, supergiants, and white dwarfs? • Why do the properties of some stars vary?
The H-R Diagram Stars with higher luminosity than main-sequence stars must have larger radii: giants and supergiants Large radius
The H-R Diagram Stars with lower luminosity than main-sequence stars must have smaller radii: dwarfs small radius
Luminosity Classes and H-R Luminosity class has a clear correlation with the size of the star
H-R diagram depicts: Temperature Color Spectral Type Luminosity Radius Luminosity Temperature
C B Which star is the hottest? Luminosity D A Temperature
C B Which star is the most luminous? Luminosity D A Temperature
C B Which star is a main-sequence star? Luminosity D A Temperature