Download
1 / 23
230 likes | 342 Vues
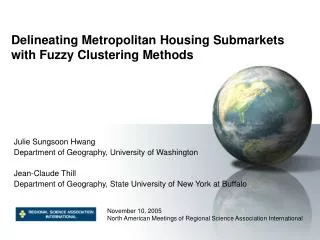
Delineating Metropolitan Housing Submarkets with Fuzzy Clustering Methods. Julie Sungsoon Hwang Department of Geography, University of Washington Jean-Claude Thill Department of Geography, State University of New York at Buffalo. November 10, 2005

E N D
Delineating Metropolitan Housing Submarkets with Fuzzy Clustering Methods Julie Sungsoon Hwang Department of Geography, University of Washington Jean-Claude Thill Department of Geography, State University of New York at Buffalo November 10, 2005 North American Meetings of Regional Science Association International
Outlines • Research objectives • Methodology: specification • Methodology: illustration • Evaluating the performance of fuzzy clustering • Conclusions
Research objectives • Demonstrate the use of fuzzy c-means (FCM) algorithm for delineating housing submarkets • Comparison to K-means • Discuss empirical characteristics of FCM applied to given applications, in particular choice of parameters • Cluster validity index
Cluster A X2 X2 Cluster A Cluster B Cluster B Cluster C Cluster C X1 X1 Housing market in metropolitan area p Housing market in metropolitan area q Challenges • Are the boundaries of clusters crisp?
Our task is to group census tracts to homogeneous housing submarkets within a metropolitan area • Using fuzzy c-means algorithm • In order to examine whether fuzzy set-based clustering can do the better job • Implemented in 85 metropolitan areas • Most of data set are public (e.g. 2000 Census) • The whole procedure is automated in GIS
Fuzzy Cluster Layer 1 2 c … Hard Cluster Layer Census Tract Layer Stepwise regression (k≤ m) … K-means Fuzzy C-means Methodology: flow chart For each metropolitan area Candidate variables National Regional Metro Local Uj: membership to cluster j Cluster Analysis Significant variables (c ≤ n) k: # selected variables c: # submarkets
Explanatory variables for house price *National Center for Education Statistics; **FBI annual report “Crime in the U.S. 2003”; *** CTPP: Census Transportation Planning Package Dependent variables: median home value of owner-occupied housing units
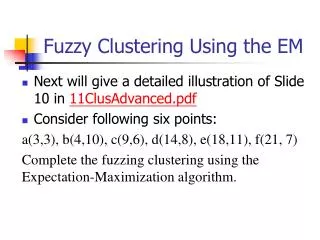
x1 x2 What is fuzzy c-means (FCM)? • Clustering method that minimizes the following objective function: Vectors of data point, 1 ≤k ≤ n Center of cluster i, 1 ≤ i ≤ c Membership degree of data point k with cluster i; [0,1] Fuzziness amount associated with assigning data point k to cluster i, 1≤ m ≤ ∞ • Updates cluster means vi and membership degree uik until the algorithm converges (III-3a) (III-3b) Source: Bezdek 1981
FCM: missing elements • Optimal number of clusters c* • Optimal fuzziness amount m* m c FCM
Extended fuzzy c-means algorithm • Step 1: Initialize the parameters related to fuzzy partitioning: c = 2 (2 ≤ ccmax), m = 1 (1 ≤ mmmax), where c is an integer, m is a real number; Fix minc where minc is incremental value of m ( 0 < minc ≤ 0.1); Fix cut-off threshold L; Choose validity indexv • Step 2: Given c and m, initialize U(0) so that it becomes the fuzzy matrix. Then at step l, l = 0, 1, 2, ….; • Step 3: Calculate the c fuzzy cluster centers {vi(l)} with (III-3a) and U(l) • Step 4: Update U(l+1) using (III-3b) and {vi(l)} • Step 5: Compare U(l) to U(l+1) in a convenient matrix norm; if || U(l+1) – U(l) || ≤ L to go step 6; otherwise return to Step 3. • Step 6: Compute the validity index for given c and m • Step 7: If c < cmax, then increase c c + 1 and go to step 3; otherwise go to step 8 • Step 8: If m < mmax, then increase mm + minc and go to step 3; otherwise go to step 9 • Step 9: Obtain the optimal validity index from , optimal number of clusters c*, and optimal amount of fuzziness exponent m*; The optimal fuzzy partition U is obtained given c* and m*
Cluster validity indices Partition coefficient Partition entropy SVi index where w is set to 2 in this study Xie-Beni index
Determining c* and m* • Selected validity indices are calibrated over the study set Xie-Beni index is recommended as a validity index Average m* is 1.38
Dimensionality of Buffalo housing market Hedonic regression equation of median home value in Buffalo, NY Adjusted R sq = 84.3%
Optimal number of housing submarkets c*, Optimal fuzziness amount m*, Buffalo, NY Values in the cell represent Xie-Beni index given c and m
Membership to Cluster 1 Membership to Cluster 2 Membership to Cluster 3 Defuzzified Clusters Buffalo housing submarkets c* = 3; m* = 1.3
Compare FCM with K-means (KM) • Compare the sum of squared error derived from KM (m=1) and FCM (m=m*) given c* Fuzzy clustering outperforms crisp clustering
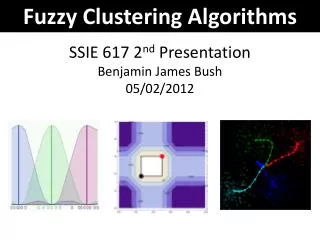
Conclusions • Fuzzy set theory provides a mechanism for uncertainty handling involved in classification task • Fuzzy c-means algorithm is of practical use in delineating housing submarkets • Fuzzy set theory needs further attention in social science fields • More works on the choice of parameters are needed