Clustering methods
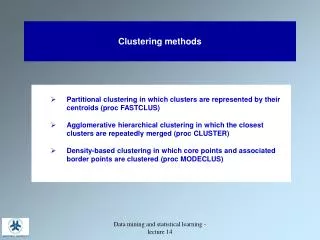
Clustering methods. Partitional clustering in which clusters are represented by their centroids (proc FASTCLUS) Agglomerative hierarchical clustering in which the closest clusters are repeatedly merged (proc CLUSTER)

Clustering methods
E N D
Presentation Transcript
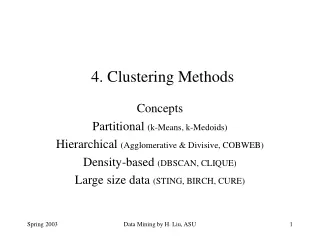
Clustering methods • Partitional clustering in which clusters are represented by their centroids (proc FASTCLUS) • Agglomerative hierarchical clustering in which the closest clusters are repeatedly merged (proc CLUSTER) • Density-based clustering in which core points and associated border points are clustered (proc MODECLUS) Data mining and statistical learning - lecture 14
Proc FASTCLUS • Select k initial centroids • Repeat the following until the clusters remain unchanged: • Form k clusters by assigning each point to its nearest centroid • Update the centroid of each cluster Data mining and statistical learning - lecture 14
Identification of water samples with incorrecttotal nitrogen levels Data mining and statistical learning - lecture 14
Identification of water samples with incorrect total nitrogen levels- 2-means clustering Initialization problems? Data mining and statistical learning - lecture 14
Limitations of K-means clustering • Difficult to detect clusters with non-spherical shapes • Difficult to detect clusters of widely different sizes • Difficult to detect clusters of different densities Data mining and statistical learning - lecture 14
Proc MODECLUS • Use a smoother to estimate the (local) density of the given dataset • A cluster is loosely defined as a region surrounding a local maximum of the probability density function Data mining and statistical learning - lecture 14
Identification of water samples with incorrecttotal nitrogen levels- proc MODECLUS, R = 1000 What will happen if R is increased? Data mining and statistical learning - lecture 14
Identification of water samples with incorrecttotal nitrogen levels- proc MODECLUS, R = 4000 Data mining and statistical learning - lecture 14
Identification of water samples with incorrecttotal nitrogen levels- proc MODECLUS, method 6 Why did the clustering fail? Data mining and statistical learning - lecture 14
Limitations of density-based clustering • Difficult to control (requires repeated runs) • Collapses in high dimensions Data mining and statistical learning - lecture 14
Strength of density-based clustering Given a sufficiently large sample, nonparametric density-based clustering methods are capable of detecting clusters of unequal size and dispersion and with highly irregular shapes Data mining and statistical learning - lecture 14
Identification of water samples with incorrecttotal nitrogen levels- transformed data Data mining and statistical learning - lecture 14
Identification of water samples with incorrecttotal nitrogen levels- proc MODECLUS, R = 2000, transformed data Data mining and statistical learning - lecture 14
Preprocessing • Standardization • Linear transformation • Dimension reduction Data mining and statistical learning - lecture 14
Postprocessing • Split a cluster • Usually, the cluster with the largest SSE is split • Introduce a new cluster centroid • Often the point that is farthest from any cluster center is chosen • Disperse a cluster • Remove one centroid and reassign the points to other clusters • Merge two clusters • Typically, the clusters with the closest centroids are chosen Data mining and statistical learning - lecture 14
Profiling website visitors • A total of 296 pages at a Microsoft website are grouped into 13 homogenous categories • Initial • Support • Entertainment • Office • Windows • Othersoft • Download • ….. • For each of 32711 visitors we have recorded how many times they have visited the different categories of pages • We would like to make a behavioural segmentation of the users ( a cluster analysis) that can be used in future marketing decisions Data mining and statistical learning - lecture 14
Profiling website visitors- the dataset Why is it necessary to group the pages into categories? Data mining and statistical learning - lecture 14
Profiling website visitors- 10-means clustering Data mining and statistical learning - lecture 14
Profiling website visitors- cluster proximities Data mining and statistical learning - lecture 14
Profiling website visitors- profiles Data mining and statistical learning - lecture 14
Profiling website visitors- Kohonen Map of cluster frequencies Data mining and statistical learning - lecture 14
Profiling website visitors- Kohonen Maps of means by variable and grid cell Data mining and statistical learning - lecture 14
Characteristics of Kohonen maps • The centroids vary smoothly over the map • The set of clusters having unusually large (or small) values of a given variable tend to form connected spatial patterns • Clusters with similar centroids need not be close to each other in a Kohonen map • The sizes of the clusters in Kohonen maps tend to be less variable than those obtained by K-means clustering Data mining and statistical learning - lecture 14