Monopoly Simulation: Fish-shaped plates
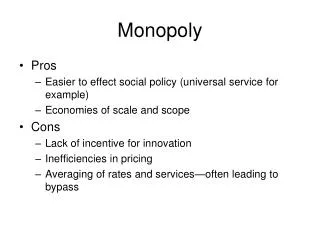
This simulation explores the economics behind the production of fish-shaped plates over a decade, evaluating pricing strategies and their impact on economic profits. Starting with a selling price of $16 and a quantity of 4,000 units, the simulation analyzes changes in market demand, fixed costs, and economic profit. The iterations demonstrate the effects of lobbying, price ceilings, and shifts in demand on profitability. Key findings reveal maximum profit points and strategic decisions to navigate fluctuating market conditions effectively.

Monopoly Simulation: Fish-shaped plates
E N D
Presentation Transcript
Monopoly Simulation:Fish-shaped plates ECO 284 – Foster – Fall 2011
Decision: Pick P,Qto maximize profits Economic profit = TR – TC TC = TVC + TFC TVC = AVC * Q Year 1: P=$16 Q=4,000
Year 2 – Business selling price • Minimum price = remaining economic profit • At 9 years * $8,000, selling price = $72,000 • P=$16 • Q=4,000 • Econ profit = $8,000
Year 3 – FC to $16,000 • No change in profit max. choices, but profit is less than before. • P = $14 Q = 4,000 • Econ Profit = $4,000
Year 4 – Increased Demand • P= $17 Q = 6,000 Econ profit = $18,980
Year 5 - Lobbyists • 25% of remaining economic profit • ($18,980)*(6 years)*(.25) = $28,470 • P = $17 Q = $6,000 Econ profit = $18,980
Year 6 - fixed costs No change in profit max. choices, but profit is more than before. P = $17 Q = 6,000 Econ Profit = $24,980
Year 7 – demand • P=$16 q = 4,000 Econ profit = $10,000[Same P/Q outcome as years 1, 2, 3!]
Year 8 – demand, FC • P = $14 Q = 3,000 Econ Profit = $2,010
Year 9 – $15 price ceiling • P= $15 Q = 5,000 Econ profit = $13,900
Year 10 - $10 price ceiling • Best option is to shut down!! • Econ profit = -$6000
Monopoly Simulation:Fish-shaped plates ECO 284 – Foster – Fall 2011