Download
1 / 28
280 likes | 292 Vues
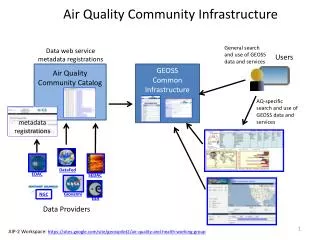
Simplifying data discovery, access, and analysis for air quality information. Consolidating relevant datasets and providing useful metadata. Offering data retrieval, transformation, visualization, and analysis services.

E N D
The Visibility Information Exchange Web System (VIEWS) Air Quality Community Summer 2009 Meeting Santa Barbara Cooperative Institute for Research in the Atmosphere
What user needs are we focused on? • Simplifying data discovery, access, and analysis • Consolidating relevant datasets with an integrated set of tools • Providing useful, core metadata while minimizing metadata “overload” • Suggesting appropriate applications for data • Facilitating inter-comparison of datasets • Providing expert interpretations of data
What services will we offer? • Raw data and metadata retrieval (e.g. download all IMPROVE data for 2007) • Spatial data retrieval (e.g. retrieve a map of interpolated NO2 from OMI) • Data coincidence discovery (e.g. show me all the fires within 100km of a site) • On-the-fly transformation and formatting of data and metadata • Upload and management of user-supplied data and metadata • Generation of visualization and analysis products • Developer access to “embeddable” components, data feeds, and tools
What services could we use? • Data “re-gridding” (i.e. two-way, on-the-fly or asynchronous transformation from one grid resolution to another)
What common infrastructure is most needed? • A consolidated, uniform understanding and description of the many levels of the metadata hierarchy (see the “Barriers” slide): In other words, one person’s metadata may be another person’s data, or vice versa. We need a common infrastructure for identifying, describing, and structuring our many-tiered metadata more coherently. • A more thorough, community-wide understanding of data exchange standards (such as the OGC standards): Just because a certain set of standards is supported by a given system, it doesn’t automatically mean that those standards are supported usefully. • A minimum level of maintenance funding to support ongoing participation in efforts like GEOSS (see the “Barriers” slide)
What are the barriers to this common infrastructure? • Currently-funded project demands must always take precedence over pro-bono collaborations (i.e. GEOSS), so momentum is difficult to create and maintain even when interest is high. • Widely-varying needs and opinions about what constitutes appropriate “metadata” complicate standardization efforts. The many different “hierarchies of metadata” need to be better identified, understood, and codified. Modeling metadata in particular lacks a uniform standard that consolidates the description of initial and boundary conditions, parameters, assumptions, algorithms, methodologies, etc. • There is little strategic oversight or planning at a “high” level to direct individual efforts toward common goals, so there is much overlap between efforts and similar functionality gets developed over and over. Well-intentioned projects often turn into “one-off” efforts that fail to leverage or build upon previous work in an organized, orchestrated manner.
This slide intentionally left black to separate new slides (1 – 6) from old slides (8 – 28) that could be used for additional content.
NASA ROSES Project: Overview • Title: • Improving Air Quality Analysis and Planning through the Integration of Satellite Data with Ground-based Observations, Modeling Results, and Emissions Estimates (Co-PIs: Shankar, McClure; awarded in 2008; work ongoing through 2011) • Goals: • Provide for the visualization and analysis of satellite data in combination with monitoring, modeling, and emissions data • Develop routine capture, analysis, and processing algorithms with high temporal and spatial resolution in order to provide better land use/land cover model inputs • Obtain finer temporal and spatial resolution of emissions data in remote areas and from individual sources and source clusters • Improve boundary and other modeling inputs with four-dimensional pollutant data • Evaluate gridded chemistry-transport models, such as CMAQ
NASA ROSES Project: CIRA activities so far • Conducted a project design workshop (May 2008, CIRA) • Refined the project scope and plan • Acquired the following datasets: • Aura OMI Level 2G • Aura OMI Level 3 • Aqua MODIS Level 3 • Terra MODIS Level 3 • Terra and Aqua MODIS AOD on the CMAQ grid • CALIPSO Level 2 on a 12x12km CMAQ NCEP grid • Explored the structure and organization of available data • Identified the parameters to extract and/or utilize from the raw data • Determined bandwidth and speed limits for data download operations • Estimated storage requirements and data download frequencies • Created a prototype visualization tool: http://vista.cira.colostate.edu/nasa • Created a project website and wiki: http://vista.cira.colostate.edu/airdatawiki
EPA Ozone and Multiple Pollutant Project • Goals: • Evolve VIEWS into a multiple-pollutant data system • Expand the scope of VIEWS beyond regional haze • Tasks: • Collaborate with the EPA to define requirements, tasks, and output products • Import the raw hourly ozone data into the VIEWS integrated database • Determine the desired aggregations and subsets of the data to provide • Design the end user output products and tools for exploring and analyzing the data
Collaborations and Community Activities • EPA Data Summit (RTP): • Convened groups with key roles in managing, analyzing, and disseminating earth observation data in order to explore efficient means of leveraging existing efforts • Explored mechanisms and potential opportunities for “interoperability” between systems • Assisted EPA/OAQPS in honing its role in the larger earth observation community • Established a community-wide strategy for responding to user-defined needs • EPA Data Summit link: http://wiki.esipfed.org/index.php/Data_Summit_Workspace • Earth Science Information Partners (ESIP) Federation • Collaborate on interoperability efforts for data/metadata discovery and exchange • Contribute data and services to the Earth Information Exchange • ESIP website: http://www.esipfed.org/ • GEO/GEOSS Architecture Implementation Pilot (AIP) 2 • Contribute components and services to the GEOSS registry • Participate in efforts to standardize and streamline data discovery and exchange • Develop VIEWS/TSS as an “persistent operational exemplar” of the GEOSS architecture • GEOSS AIP 2 link: http://www.ogcnetwork.net/AIpilot
VIEWS Interoperability: Services and standards • “Interoperability”: The ability of diverse systems and organizations to work together to exchange and utilize information. • To facilitate this, VIEWS will offer the following services and features: • Discovery, retrieval, and exchange of data and metadata • On-the-fly transformation and formatting of data and metadata • Upload and management of user-supplied data and metadata • Generation of visualization and analysis products • Availability of “embeddable” components and tools • Support of OGC web standards for spatial data exchange
VIEWS Interoperability: Connected systems • WRAP FETS: Incoming prescribed fire data via a co-located database • WRAP EDMS: Incoming WRAP emissions inventories • WRAP Regional Modeling Center (RMC): Incoming modeled emissions data; necessary for chemical transport modeling data, modeling data results, and gridded emissions inventories that cannot be obtained elsewhere • AQS: Outgoing IMPROVE data, incoming PM2.5, PM10, Ozone, etc • AirQuest: Incoming satellite data; other datasets being considered • AirNow: Incoming Air Quality Index maps and ozone data • DataFed: Outgoing IMPROVE data via direct ODBC connection to the VIEWS database; various incoming datasets • RSIG: Incoming satellite data and products (future) • Giovanni: Incoming satellite data and products • NASA DAACs: Incoming satellite data and products • BlueSky Framework: Pending proposal; Hybrid source apportionment model to be provided by NPS to BlueSky through web services
Leveraging the VIEWS Architecture (cont’d) • First question we ask ourselves when designing a new feature: • “Can its design be generalized for VIEWS while providing for customization and domain-specific use by connected systems?” • If “yes”, then the benefits are: • Project and configuration management are simplified • Dependent systems can be more “lightweight” • The system as a whole can be extended more easily • Past and current investments are leveraged and maximized • Interoperability and data sharing with external systems is made easier • Developers can “implement once, reuse often” • Collaboration is facilitated and expedited
Additions to the VIEWS team • John Huddleston • Design and development • System administration • Data acquisition and management • Duli Chand • Data analysis • Scientific research • Design of visualization and analysis features
Updated hardware infrastructure • Database server: 2.5 – 5 Terabytes of storage; data storage, transformation, and access • Web server: Pages, services, and tools • File server: Documents, images, photos • GIS Server: ESRI suite of tools, static base map collection • Processing Server: IDL operations, contour maps, intensive processing • Relocation to dedicated server room • Overall, ongoing goal: Leverage resources and facilities already available from CIRA
New VIEWS website • The new website has been in development for approximately 24 months • The first official launch is planned for the latter part of Q2 2009 • Additional updates and additions are planned throughout 2009 as part of a progressive roll-out • Introduces a new look-and-feel, layout, and navigation scheme • Incorporates new web technologies, design principles, and performance optimizations • Adds a “developer center” that contains instructions and guidelines for using VIEWS web services and embeddable components • Integrates the user registration and authentication infrastructure for VIEWS, TSS, ATDA, and other VIEWS systems • Uses Google Analytics for website traffic and usage statistics • Incorporates Google Maps into key tools • Provides context-sensitive tooltips and “hot links” that are integrated with the VIEWS glossary
New VIEWS website (cont’d) • Provides an updated version of the Database Query Wizard that allows the user to obtain much more than just raw data • Introduces a “Dataset Catalog” that facilitates the browsing, searching, and exploration of VIEWS datasets • Offers an updated Metadata Browser that uses Google Maps for exploring monitoring site metadata • Introduces dynamic Air Quality Index (AQI) maps via real-time retrieval from the AirNow website • Provides an improved webcams page that is better organized and allows for searching and sorting • Adds a large Glossary of Terms that allows for quick browsing and mouse-over tooltips throughout the website • Introduces a “Rosetta Stone” for comparing and cross-referencing parameter definitions across different datasets • Links IMPROVE data advisories to relevant data products • Links exceptional event metadata to relevant data products
Future goals and plans • Work with UCD to decrease the time lag for disseminating IMPROVE datasets • Goal for routine data updates: No more than a 3 month lag between data availability and public dissemination • Goal for RHR datasets: No more than a 4 month lag between routine IMPROVE data dissemination and RHR data dissemination • Increase the efficiency of preliminary IMPROVE data review: Consider creating an online review and approval tool for expediting the review process • Import other datasets on a more frequent, up-to-date basis • Work with partners in the air quality community to create more uniform flags, codes, and descriptions for data and metadata • Offer future data products as web services and re-factor existing products as web services • Offer metadata management tools for program and site managers
Future goals and plans (cont’d) • Continue participating in community interoperability efforts • Establish long term data exchange mechanisms with connected systems • Implement an online forum for questions, comments, discussions, and news • Expand the scope of the “Air Data Wiki”: http://vista.cira.colostate.edu/airdatawiki • Participate in two potential NASA ROSES projects: • Exceptional Event Decision Support System (Rudy Husar) • Make monitoring data available online and via web services • Participate in event analyses • Assist with the development of decision support tools • NAAPS Products for Air Quality Decision-making (Doug Westphal) • Discovery, display, analysis, and retrieval of NAAPS data
New and updated VIEWS tools Query Wizard Dataset Index Metadata Browser AirNow AQI Maps Webcams Page Glossary
New Metadata Browser Tabular site list for sorting and quick selection Google Maps used for showing site locations Site details and history Site photos
Glossary And Codes Key Jump to beginning letters. Glossary entries show up as tooltips whenever they’re used in web pages.
Exceptional Event Metadata Exceptional event metadata (such as fires) is stored and dynamically associated with data at run time in order to better inform the user about the context of the data. “Bisquit” fire impacting Crater Lake in 2002
IMPROVE Data Advisories IMPROVE Data Advisories document interesting findings from the IMPROVE database such as data anomalies, potential problems, and new uses for the IMPROVE data. These advisories are stored as metadata in the VIEWS database and dynamically associated with data and products. When a user selects data, the systems checks for any advisories relevant to the data selected and attaches them to the output.