Download
1 / 76
760 likes | 923 Vues
HISPANIC REALITIES IN NORTH AMERICA Implications for UBA Daniel R. Sánchez. REALITY # 1. The growth of the Hispanic American population has exceeded even the boldest projections of demographic experts. Between 1970 and 2005 THE HISPANIC POPULATION Grew by 32 MILLION (1970)

E N D
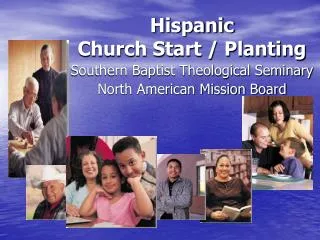
HISPANIC REALITIES IN NORTH AMERICA Implications for UBA Daniel R. Sánchez
REALITY # 1 The growth of the Hispanic American population has exceeded even the boldest projections of demographic experts
Between 1970 and 2005 THE HISPANIC POPULATION Grew by 32 MILLION (1970) TO A TOTAL OF 42 MILLION (2005) 44 MILLION (2007) (Source: Pew Hispanic Center, Roberto Suro and Jeffery S. Passel, The Rise of the Second Generation, October, 2003)
CONTRIBUTING FACTORSIMMIGRATIONSource: Current Population Survey, March 2000 • 4 of every 10 immigrants each year are Hispanic
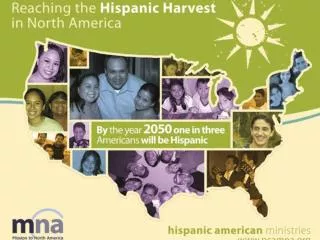
CONTRIBUTING FACTORSBIRTHSSource: Current Population Survey, March 2000 • In 1995 - 1 in every 6 was Hispanic • By 2050 - 1 in every 3 will be Hispanic)
Projected Hispanic Population Growth Population in millions Census Middle Series Projections
HISPANIC GROWTH • Hispanic Americans are now the largest minority group in America [i] • Have accounted for half of US population growth since 2000 [ii] • [i] Dallas Morning News, “Report: Hispanic Population Surging,” June, 9, 2005, 13A. • [ii] D’vera Cohn, “Hispanic population keeps gaining numbers,” Star Telegram, June 9, 2005, 5A.
REALITY # 2 Hispanics have spread throughout the country faster than any previous immigrant group
Top StatesHispanicPopulation (2005) *Population Estimates as of July 1
Top Counties Hispanic Population (2005) *Population Estimates as of July 1
Top States% Growth (2000 – 2005) (For states with 100,000 or more Hispanics in 2005) *Population Estimates as of July 1
HispanicPopulation in Texas(1980 – 2000) • City Population % Growth %of Pop Hispanic • Houston 1,247,586 211 38 • San Antonio 816,057 67 51 • Dallas 810,499 356 23 • El Paso 591,654 79 75 • McAllen 503,100 134 88 • Ft Worth 309,851 338 18 • Austin 254,039 211 38
URBAN HISPANIC GROWTH1980 - 2000 • Areas % of Hisp Pop %+ • Established Hispanic Metros – 52% 97% • New Hispanic Destinations 19% 303% • Fast-growing Hispanic Hubs 25% 235% • Small Hispanic Places 02% 81% • Total 145% (Source: “Latino Growth in Metropolitan America, ”The Brookings Institution Center on Urban & Metropolitan Policy and the Pew Hispanic Center)
Established Hispanic Metros (16) (Large base / slow growth) • City Population (2002) %+ • Los Angeles 4,242,213 105 • New York 2,339, 836 60 • Chicago 1,416,584 143 • Miami 1,291,737 123 (These “Gateway Cities” posted the largest absolute increases between 1980 and 2000)
Established Hispanic Metros(Large base / slow growth) • Pop 1980 Pop 2002 % Change • 7,180,206 14,119,006 97% • Cities: Albuquerque, Chicago, Denver, El Paso, Fresno, Jersey City, Los Angeles, Mc Allen, Miami. New York, Oakland, San Antonio, San Francisco, San Jose, Tucson, Ventura
Fast Growing Hispanic Hubs (11)(Large base / fast growth) • City Population (2000) %+ • Houston 1,248,586 21 • Dallas 810,499 358 • Austin 327,760 211 • Bakersfield 254,760 192
Evangelistic Implications • 1. The Hispanic population is growing in all metropolitan areas – Urban strategies are needed • 2. New patterns of growth have developed. • New Destinations • Suburbs • Adjoining towns • 3. Metro areas can serve as hubs for evangelistic dissemination. Like Paul’s urban strategy (e.g., Ephesus) (Source: “Latino Growth in Metropolitan America,”The Brookings Institution Center on Urban & Metropolitan Policy and the Pew Hispanic Center)
REALITY # 3 The First Generation (the immigrants) has become the largest segment of the Hispanic population (Source: Pew Hispanic Center, Roberto Suro and Jeffery S. Passel, The Rise of the Second Generation, October, 2003)
COMPARISON(2000) Generation Total % (in millions) (Of Hispanic Pop) 1st 14.2 40 2nd 9.9 28 3rd+ 11.3 32 (Source: Pew Hispanic Center, Roberto Suro and Jeffery S. Passel, The Rise of the Second Generation, October, 2003)
GENERATIONAL SHIFTS • In mid 20th century, 3rd + generation was dominant & had deepest roots in U.S. culture • By 1990, 1st generation became the largest segment of Hispanic population
PROJECTIONS Generation 2000 2010 2020 % % % 1st 40 38 34 2nd 28 32 36 3rd+ 32 30 30 1. Until 2020 the 1st generation will be the largest 2. The 3rd generation will remain about one third 3. From 2020 on, the 2nd generation will be the largest
REALITY # 4 The use of the Spanish language has increased in the past two decades (Source: Pew Hispanic Center, Roberto Suro and Jeffery S. Passel, The Rise of the Second Generation, October, 2003)
SPANISH BY GENERATIONS GenSpanish Bilingual English Dominant Dominant 1st 72% 24% 4% 2nd 7% 47% 46% 3rd+ 0% 22% 78%
EVANGELISTIC CHALLENGES • 1. Reaching the immigrant generation primarily utilizing the Spanish language • 2. Reaching the 2nd and 3rd generation with bi-lingual and English-dominant strategies
REALITY # 5 Regarding educational attainment, the 2nd and 3rd generations have made significant strides yet the 1st generation lags behind (Source: Pew Hispanic Center, Roberto Suro and Jeffery S. Passel, The Rise of the Second Generation, October, 2003)
EDUCATION(Age 25 to 64) Gen Less than High School Some College High School Graduate College Graduate 1st 54% 24% 13% 9% 2nd 23% 33% 29% 15% 3rd 25% 35% 27% 13%
EDUCATIONAL CHALLENGE • 1. Providing GED opportunities for Hispanic youth and adults • 2. Encouraging Hispanic young people to complete their high school education • 3. Encouraging 2nd and 3rd generation Hispanics to avail themselves of existing educational programs in universities and seminaries
DUAL CHALLENGE • 4. Making provision for entry-level 1st generation Hispanics who are called to ministry • 5. There is a desperate need SBC educational institutions to work together to build ramps which start at the entry level but continue on to baccalaureate and graduate levels
REALITY # 6 • Hispanics are showing more receptivity to the evangelical message than ever before in the history of this country
Religious Preference Country Catholic Evangelical • Mexico 76% 16% • Puerto Rico 55% 29% • Central America 51% 29% • South America 70% 18% • Cuba 64% 20% • Dominican 74% 15% • All Other 46% 38% (Source: Pew Hispanic Center/Kaiser Family Foundation, 2002 National Survey of Latinos)
GREELEY’S STUDY • “23 percent of the Hispanic population now identifies with Evangelical & Protestant denominations” [i] Andrew Greeley, “Defection Among Hispanics,” America (July 30, 1988).61.
PEW’S STUDY • 20 percent of Hispanics are “Evangelical or Born Again” • 9 percent are “Other Christian” • Source: Pew Hispanic Center/Kaiser Family Foundation, 2002 National Survey of Latinos, December 2002, 53.
Latest PEW Study • More than 50% of Hispanics are seeking a more direct and personal relationship with God than what they find in their traditional religious practices • PewHispanic Center, “ChangingFaiths: Latinos and Transformation of American Religion.” 2007
EVANGELISTIC IMPLICATIONS • The Hispanic fields are white unto harvest • The religious background of many Hispanics favorably predisposes them to the evangelical message if it is presented in a positive, sensitive way • Most of our church members need to be trained on how to share the good news with Roman Catholic friends.
MISSIONARY IMPLICATIONS • Because of their bi-lingual and bi-cultural background (like the Apostle Paul), Hispanics can be among the most effective missionaries in highly strategic parts of the world. • Missions education which stresses the positive aspects of Hispanic identity is urgently needed
Strategies • Evangelism • A. Friendship Evangelism • B. Positive Evangelism • Church Planting • A. House Churches • B. Cell-based Churches
REALITY # 7 • Hispanics are typically very conservative regarding social values
FAMILY VALUES • A strong attachment to family is evident among Hispanics who predominantly speak English and are generations removed from the immigrant experience • A majority of Hispanics maintain that children growing in the US will stay close to their families (Source: Pew Hispanic Center/Kaiser Family Foundation, 2002 National Survey of Latinos)
FAMILY VALUES “For Hispanics political concerns reflect the fact that they are more likely to be married and have children than other Americans” Source: William Frey, Demographer, Brookings Institution.
FAMILY VALUES “Leading Hispanics to a personal faith in Christ and discipling them could contribute to the strengthening of the moral and religious values that are needed in our country today.” Source: Daniel R. Sanchez.
REALITY # 8 • 2nd and 3rd generation Hispanics have made significant strides financially yet typically newly arrived Hispanics have the most difficult time financially
Household IncomeHispanics • Foreign-Born Native-Born • >30,000 57% 37% • 30,000-49,000 20% 28% • 50,000+ 11% 27% • Don’t Know 12% 09% (Source: Pew Hispanic Center/Kaiser Family Foundation, 2002 National Survey of Latinos)
OccupationHispanics • Foreign-Born Native-Born • White-Collar 31% 69% • Blue-Collar 65% 28% • Other 03% 03%