Canada
Think Dynamic. Competitive. Think. Bottom Line. Think. Think. Canada!. Canada. Overall government budget in surplus. Excellent economic fundamentals. Low inflation and low interest rates. Easy access to markets. Geography and NAFTA provide easy access to the world's most prosperous


Canada
E N D
Presentation Transcript
Think Dynamic Competitive Think Bottom Line Think Think Canada! Canada
Overall government budget in surplus. Excellent economic fundamentals Low inflation and low interest rates. Easy access to markets Geography and NAFTA provide easy access to the world's most prosperous market. A cost-competitive business environment An excellent place to live Large stock of skilled workers; low start-up costs; competitive tax system (particularly for R&D); strong technological environment; positive business climate. Superb overall quality of life. 2 Canada: a Dynamic, Competitive Economy — Open for Global Business Canada's economic fundamentals and relative cost advantages provide a first-rate business environment. Report Card Canada provides: Canada
Excellent economic fundamentals Excellent economic fundamentals Canada 3 3 Canada Provides: Excellent economic fundamentals Easy access to markets A cost-competitive business environment An excellent place to live and work
The Institute for Management Development ranked Canada as the best fiscally managed country in the G-7 in 2000 Surplus % of GDP + 0.0 Deficit -3.0 -6.0 2000-01 2001-02 1992-93 1993-94 1995-96 1997-98 1994-95 1996-97 1998-99 1999-2000 Source: Finance Canada 4 Canada’s strong fiscal situation • Canada's fiscal situation has turned around dramatically: • In 1994, Canada’s deficit (as a percentage of GDP) was 6.7%, the third highest in the G-7. • However, by 1997, Canada became the first G-7 country to post a surplus in the 1990s, and is the only G-7 nation expected by the OECD to post two straight financial surpluses from 2002 to 2003. • Federal government spending (as a % of GDP) reached a 50-year low in the 2000-01 fiscal year, the key source of the Canadian fiscal turnaround. Federal Budgetary Balance Public Accounts Basis C Federal Program Spending Public Accounts Basis % of GDP Projected 10 Total Government Surplus* 16 8 6 4 2 14 % of GDP 0 -2 -4 12 -6 -8 1994 1995 1996 1997 1998 1999 2000 2001 2002** 2003** 10 * Includes federal, provincial/state and local ** Projections Source: OECD Economic Outlook, June 2002 2003-04 2002-03 1995-96 1993-94 1997-98 1998-89 2000-01 2001-02 1994-95 1999-00 1996-97 Canada
Canada 5 A Strong Fiscal Surplus Total G-7 Government Fiscal Balance (% of GDP) 2001-2003 4 2 • Canada had the highest general government surplus as a percentage of GDP in the G-7 in 2001. The OECD expects Canada to be the only G-7 country with fiscal surpluses in 2002 and 2003. 0 -2 2003 -4 2002 2001 -6 -8 -10 Italy U.K. U.S. Japan France Canada Germany Source: OECD Economic Outlook, June 2002
Canada 6 Low Inflation and Low Interest Rates Inflation 4 • Canada’s targeted inflation rate is locked between 1% to 3%. • Over the past five years, Canadian inflation averaged 1.9% 3 2 Year-Over-Year % Change 1 0 1994 1997 1995 1999 2000 2001 1996 1998 Sources: Statistics Canada and the Federal Reserve Bank of St. Louis % Long-Term Interest Rates 10 • Canada's excellent fiscal situation and low inflation are reflected in low domestic interest rates. 8 5 3 1994 1995 1996 1997 1998 1999 2000 2001 2002 Last data points plotted: Canada – August 2, 2002; U.S. – August 12, 2002 Source: Bank of Canada, Government long-term bond. U.S. Treasury, Constant Maturity long-term bond.
Canada 7 A Growing Domestic Economy Real GDP Growth Projections 2002-2003 (%) 4 3.6 3.4 3.0 2.9 2.8 2.7 2.5 2.3 2.0 2 • Canada’s GDP grew at an annual rate of 6.0% in the first quarter, similar to U.S. growth but much stronger than growth in other G-7 countries. • The OECD and IMF both forecast Canada to lead the G-7 in economic growth in 2002 and 2003. 1.4 1.4 0.9 0.8 0 2003 2002 Canada France Italy -1.0 Germany U.S. U.K. Japan Source: International Monetary Fund, May 2002 4.0 4 3.5 3.2 3.0 2.8 2.8 2.5 2.5 1.9 2 1.5 1.4 0.7 0.3 0 2003 2002 -0.7 Italy Canada France U.S. Germany U.K. Japan Source: OECD Economic Outlook, June 2002
Easy access to markets Canada 8 Canada Provides: Excellent economic fundamentals Excellent economic fundamentals Easy access to markets A cost-competitive business environment An excellent place to live
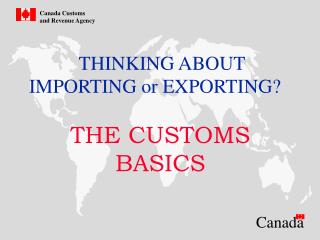
Canada 9 Streamlined Border Flows • Since the enactment of the North American Free Trade Agreement (NAFTA) in 1994, Canada provides long-term assured access to the North American market — nearly 400 million people with a combined GDP of over $9.4 trillion ($U.S.). • In addition to eliminating tariffs, NAFTA provides procedures for: • border facilitation; • movement of personnel; • investment and intellectual property protection; and • product certification. • The North American market is serviced through a well integrated transportation system which is among world’s best. • - Automated permit ports, transponder identification systems and joint processing centres are being tested and deployed. Annual Transborder Crossings - Total Number of Trucks and Canada-US Air Passengers Entering Canada 20 Air 15 10 5 Truck 0 80 82 84 86 88 90 92 94 96 98 2000 Source: Transport Canada and Statistics Canada, 2001
Canada 10 Smarter Borders • Efficient border crossing was restored within a week of the tragic events of Sept 11th • today, border wait times average less than 10 minutes • In December, Canada and the USA signed a declaration to build a Smart Border for the 21st Century to accommodate the growth in trade and commerce • initiatives focus on improving existing border processes through the use of new technologies and infrastructure • The December Budget also allocated $1.6 billion over the next five years for border initiatives
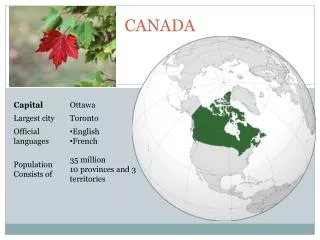
300 mi St. John's Edmonton Charlottetown 600 mi Québec Fredericton Regina Calgary Montréal Victoria Vancouver Halifax Ottawa Winnipeg Seattle Toronto Boston Windsor Milwaukee New York Chicago Detroit Philadelphia Cleveland Baltimore Pittsburgh St. Louis Washington San Francisco Denver Atlanta Los Angeles Houston Miami Mexico City Canada 11 …and Short Distances to Markets • Almost half of the U.S. population lives within a 10 hour drive of Toronto, and over 60 percent within a two hour flight. • Business travel between Canada and the U.S. has increased considerably since the inception of the “Open Skies*” Agreement (February, 1995) • Direct air service between major cities in Canada and the U.S. has nearly doubled in 6 years. • *Under “Open Skies” Canadian Air Carriers gained unlimited rights to establish routes from any point in Canada to any point in the United States. Similarly, U.S. carriers also gained unlimited access to the Canadian market (with a phase in period for up to three years)
Canada 12 Canada Is by Far the Largest U.S. Trading Partner • Canada and the U.S. have the world’s largest trade partnership, with two-way trade amounting to $700 billion in 2000. In fact, this averages to more than $1.3 million dollars a minute in trade. • Between 1995 and 2000, trade between Canada and the U.S. grew at a compound average annual rate of 10.4%. • The U.S. trades more with Canada than with any other country - the U.S. trades more with Canada than with all of the countries of the E.U. combined! Canada - U.S. Trade $ Billions 800 $700 Billion 700 600 500 400 300 200 100 0 1995 1996 1997 1998 1999 2000 Source: Statistics Canada Distribution of U.S. Trade* — 2000 Mexico 12.4% Japan Canada 10.6% 20.3% China 5.8% Germany 4.4% All Others 46.5% * Merchandise trade Source: World Trade Atlas
Canada 13 Canada Welcomes Foreign Investment Distribution of Foreign Direct Investment • Foreign direct investment in Canada has more than doubled since 1990. • Increasingly more investment goes to knowledge-based industries in high-tech manufacturing and services sectors. • The U.S. is the dominant source of foreign capital. • - In 2001, the U.S. share of foreign direct investment (FDI) in Canada was 67%. by Industry 2001 1990 Machinery & Transportation $131 Billion $321 Billion Source: Statistics Canada 2001 Distribution of Foreign Direct Investment by Region/Country Source: Statistics Canada
$340 Billion Canada 14 The United States is Canada’s Largest Source of FDI Canada - U.S. Direct Investment Stock • Canada and the U.S. have one of the world’s largest direct investment partnerships, with the stock of investment between the two countries totaling $340 billion in 2000. • Between 1990 and 2000, U.S. foreign direct investment in Canada grew at an average annual rate of 6.9%. • Over this period, Canadian direct investment abroad grew at an average annual rate of 8.2%. $ Billions 350 300 250 200 150 100 50 0 1990 1991 1992 1993 1994 1995 1996 1997 1998 1999 2000 Source: Statistics Canada Distribution of Canadian Total Direct Investment Stock 7.5% U.K. France 5.5% United States Netherlands 3.5% 57.4% 3.3% Barbados 2.4% Japan 20.4% All Others Source: Statistics Canada
A cost-competitive business environment Canada 15 Canada Provides: Excellent economic fundamentals Excellent economic fundamentals Easy access to markets A cost-competitive business environment An excellent place to live and work
Canada 16 Superior Quality Workforce • The overall skill level of Canada's workforce ranks high among competing countries. • According to the World Competitiveness Yearbook, Canada has the highest percentage of individuals achieving at least college or university education. * Percentage of the population that has attained at least tertiary education among 49 countries considered in the World Competitiveness Yearbook, 2002.
Canada 17 An Excellent Post Secondary System RANKING OF ELECTRICAL ENGINEERING UNIVERSITY PROGRAMS Institution Score U.S. Cdn. Rank Rank • 1998 U.S. Gourman report scored 10 Canadian electrical engineering programs in the top 22, and 18 in the top 40 • Canada’s 67 universities and colleges produce more than 25,000 graduates per year in math, engineering and pure and applied sciences M.I.T. 4.92 1 Stanford 4.91 2 Berkeley 4.88 3 Illinois 4.86 4 Toronto 4.86 1 UCLA 4.82 5 McGill 4.82 2 Cornell 4.81 6 U.B.C. 4.81 3 McMaster 4.80 4 Purdue 4.79 7 Southern California 4.77 8 Princeton 4.76 9 Michigan 4.75 10 Carnegie Mellon 4.74 11 Polytechnic-Brooklyn 4.73 12 Queen’s 4.72 5 Alberta 4.72 6 Calgary 4.71 7 Polytechnique, Mtl. 4.70 8 Saskatchewan 4.70 9 Manitoba 4.70 10
* Standing among 75 countries. Index based on the availability of Management education in first-class business schools. Source: Global Competitiveness Report, 2001-2002 Canada 18 Skilled Management Management Education* World Rank 1st 2nd • Canada ranks third among the G-7 and fourth overall in a 75-country study of locally available Management education in first-class business schools. • - Eight Canadian business schools are ranked among the top 100 Management Schools in the world according to a January 2001 survey by the Financial Times (UK). 4th 6th 21st 31st 49th Index U.K U.S. Italy Japan France Canada Germany
Full-time, full-year wages* ($U.S. PPP**) Life Science Professionals Physical Science Professionals Computer Programmers*** Electrical and Electronic Engineers Chief Executives $42,097 $46,348 $36,467 $48,945 $59,608 $49,469 $52,423 $54,960 $62,309 $101,240 Canada 19 Low Labour Costs U.S.=100 • According to the U.S. Bureau of Labor Statistics, labour costs in Canadian manufacturing (wage and non-wage) are the lowest in the G-7. • Occupational wages are also lower in Canada for knowledge workers. * Figures are for 1999. Source: U.S. Bureau of Labor Statistics Occupational Wages — Knowledge Workers, 1999 * Canadian data have been converted to full-year assuming a 52-week work year. ** Purchasing power parity for 1999 *** date for computer programmers based on average for 1997, 1998, 1999 Source: IC calculations based on Statistics Canada Labour Force Survey and U.S. Bureau of Labour Statistics Occupational Employment and Wage Estimates
3rd Index 8th 20th 45th 50th 59th 72nd U.S. Italy U.K. Japan France Canada Germany Canada 20 Plenty of Natural Resources Natural Resource Endowments — World Rank* • Canada is extremely well endowed with natural resources. • Canada ranks 3rd in the world in natural resource endowments, well ahead of other G-7 countries. * Measured in terms of thousands U.S.$ per capita. Standing among 92 countries. Source: World Bank, 1997 • Canada is the only G-7 country with a per capita trade surplus in non-energy raw materials. * Includes: crude fertilizers and crude minerals; metalliferous ores and metal scrap; iron and steel; and non-ferrous metals. Source: World Competitiveness Yearbook, 2002.
Canada 21 A Tax Advantage for Firms to Expand in Canada • Canadian locations compare well internationally in terms of statutory corporate income tax rates. • The federal government and some provinces have announced sharp cuts in corporate taxes, to take effect over a five-year period. • The Economic Statement and Budget Update accelerated the pace of this tax relief. • By 2005, firms in Canada will have a 5.0% corporate income tax rate advantage over U.S. firms (including capital tax). Corporate Income Tax Rates including capital tax equivalents 46.6% 44.9% 41.5% 40.0% 38.6% 35.6% 34.6% 2002 2005 2003 2004 2001 2000 Source: Finance Canada, December 2001
Canada 22 Low Employee Benefits Employee Benefits* as a % of wages • Among the G-7, Canada has the lowest overall labour costs, including benefits. • Lower medical insurance premiums are an important reason for this. G-7 Comparison, 80 60 40 20 0 Italy Japan U.K U.S.A Canada Germany France Other Benefits Statutory • Average for 12 operations • Source: KPMG Management Consulting, 2002
0.6 Hospital, surgical, medical and major medical insurance 8.0 premiums* Short term disability, sickness 0.7 or accident insurance and long 0.7 term disability or wage continuation 0.7 Dental insurance premiums 0.5 0.1 Other (vision care, physical and mental fitness, etc.) 0.4 Canada 23 Quality Health Care at Low Cost Employer-Sponsored Health Benefits Canada and the U.S. • Canada's health care system is among the best and the cheapest in the industrialized countries: • Employer-paid health benefits as a percentage of workers' gross pay in Canada are about 22 percent of that in the U.S. • (2.1% compared with 9.6%). 2.1 Total 9.6 % of Gross Annual Payroll * U.S. value includes payments for retired employees Source: Employee Benefits, 1995, prepared by the Research Centre, Economic Policy Division , The U.S. Chamber of Commerce and KMPG, Employee Benefits Cost Survey, 1996. Adapted from KPMG report on Corporate Taxation and Employee Benefit Cost Guide for Large Service Firms, prepared for the ICT Branch, Industry Canada, March 2000
Canada 24 Low R&D Costs Relative Competitiveness of R&D Tax System • Canada offers the most favorable tax treatment for R&D among the G-7: • Canada’s combined federal and provincial tax credits reduce the after-tax cost of $100 of R&D expenditures to as low as $44. • In Canada, eligible costs include: capital equipment, overhead, process R&D, salaries, and materials. • These tax-based incentives permit firms to significantly reduce R&D costs through direct investment or sub-contracting in Canada. 0.70 Canada 0.88 U.S. 0.89 Australia 0.91 France 0.92 Korea 0.97 Mexico 1.00 U.-K. 1.01 Japan 1.02 Sweden 1.03 Italy 1.05 Germany The B-index represents a ratio of the after-tax cost of a $1 expenditure on R&D divided by 1 less the corporate tax rate. A lower B-index indicates a more competitive R&D tax system Source: Conference Board of Canada, November 1999.
Canada 25 Low Energy Costs and Rates Average Electricity Costs • Canada has abundant oil, gas, coal and hydro-electric resources. • Electricity costs for industrial users are significantly lower in Canada. G-7 Comparison Canada France U.K. Germany U.S. Italy Japan 0 50 100 150 200 250 300 350 400 $US (12 operations) Average Electricity Rates G-7 Comparison Canada France U.K. Germany U.S. Italy Japan 0 2 4 6 8 10 12 14 US cents per kWh (12 operations) Source: KPMG Management Consulting, 2002
Canada 26 Low Costs for Construction, Land, Office Lease Construction Costs G-7 Comparison, Index: U.S. = 100 Italy Canada • Canadian office lease costs are highly attractive. Lease costs include office space plus operating, utility, tax and insurance costs. France U.S. U.K. Germany Japan 0 50 100 150 200 250 300 350 G-7 Comparison, Land Costs Index: U.S. = 100 France U.S. Canada Italy U.K. Germany +1828 Japan 0 100 200 300 400 500 G-7 Comparison, Office Lease Costs Index: U.S. = 100 Italy France U.K. Germany Canada U.S. Japan 0 50 100 150 200 Source: KPMG Management Consulting, 2002
Canada 27 First-Class Technological Infrastructure Technological Infrastructure* World Rank 1st • Canada's technological infrastructure is second only to the U.S. among the G-7 — we rank above or very close to the U.S. in terms of: • internet users and internet hosts • computers per capita • Building a universal, competitive, leading edge "Information Highway" is a government priority. 5th 12th 17th 22nd 25th Index 32nd Germany U.K. Canada Japan U.S. Italy France * Standing among 49 countries. Index based on 20 characteristics including investment in telecommunications, computers in use, computer power, internet connections, number of telephone lines, cost of telephone calls and use of robotics. Source: World Competitiveness Yearbook, 2002
Canada 28 First in Internet and Wireless Affordability Internet Access Charges* – 2000 U.S. $ 93.10 59.83 56.16 49.22 Based on PPPs Peak Rate 40 hrs. Online/Month 41.72 35.83 35.40 • Canada ranks first among the G-7 in terms of wireless communications costs and second in terms of internet access charges. U.K. U.S. Canada Italy Germany France Japan * PSTN fixed charges include monthly rental fee and additional monthly charges related to discount plans, if applicable. Includes 40 one-hour calls. In France, ISP and PSTN usage charges are bundled and included under the ISP. Source: OECD, http://www.oecd.org/dsti/sti/it/com/ Wireless Communication Costs Price per minute, 1999 in U.S. $ PPP 0.36 0.36 0.32 0.31 0.29 0.18 0.09 Toronto Rome Tokyo London Paris Berlin Boston Source: Yankee Group, Wireless/Mobile Communications Global Report, Volume 3, No. 16, May 1999
Canada 29 First in Telephone Affordability Annual Business Telephone Charges U.S. $ PPP 745 Canada U.K. 1067 1076 France 1177 Germany U.S. 1215 1443 Italy • Business telephone charges are lower in Canada than in any other G-7 country. 1566 Japan Source: OECD Communications Outlook 2001 Annual Residential Telephone Charges U.S. $ PPP 286 U.K. 349 Canada 355 France 360 Germany 433 Japan 440 Italy 466 U.S. Source: OECD Communications Outlook 2001
Canada 30 Sound Financial Institutions Average Bank Financial-Strength Rating E E+ D D+ C C+ B Canada U.S. • According to Moody’s Financial Strength ratings, Canadian Banks rank 1st among the G-7 in terms of their intrinsic credit worthiness. U.K. Germany Italy France Japan B= strong intrinsic financial strength C= good D= adequate E= very weak Source: The Economist, March 2000
Canada 31 Positive Business Climate • Canada understands the importance of its business community and has created an environment to encourage its success. Source: The Economist (EIU), August 24th, 2001
Canada 32 Solid Microeconomic Policies Economic Health* • According to The Economist, Canada ranks 2nd among 21 countries in a Lehman Brothers study pertaining to the effectiveness of microeconomic or structural policies. • These rankings are based on three micro-policy categories: • policies that increase an economy’s long-term potential growth rate. For example, spending on education and R&D. • policies that affect labour market performance or reduce the lowest rate of unemployment at which inflation is stable (NAIRU). • policies that increase product market competition. Index of structural policies, 0=worst, 10=best Source: The Economist, March 17th, 2001 *Based on a study of 21 countries.
Canada 33 Less Paperwork for New Businesses Total Number of Business Start-up Procedures* • Canada makes it easier to set up a new business, with less paperwork than any other country. • Canada is the most efficient place to pull together worldwide research or production teams. Source: The World Bank and Harvard University, taken from The Globe and Mail, November 14, 2000 *Procedures divided into five major categories: Safety & Health, Environment, Taxes, Labour, and Screening.
Canada 34 Forward-Looking Framework Policies • The economic policies of the government of Canada are focused on making Canada a world leader in the global knowledge-based economy of the 21st century. Commitments include: • Making Canada the most connected Government to its citizens by 2004. • Making high-speed broadband access available to Canadians in all communities by 2005. • Becoming one of the top five countries for research and development by 2010. • Shaping a "National System of Innovation“; and • Providing marketplace frameworks/services benchmarked against the best in the world. Government Policies/Programs Aimed at Building the Knowledge Infrastructure • 21st Century Chairs for Research Excellence • Networks of Centres of Excellence • Canadian Foundation for Innovation • Canadian Institute for Health Research • Telecommunications Policy • Technology Partnerships Canada • Granting councils (NSERC, MRC, SSHRC) • Communications Research Centre • Industrial Research Assistance Programme (NRC) • Co-operative sectoral research programs (PAPRICAN) • Canadian Network for the Advancement of Research, Industry and Education (CANARIE) • SR&ED (Scientific Research & Experimental Development) tax credit for private sector research and development • Leading edge information systems: Strategis; CISTI (NRC); Cdn. Technology Network; Sector Competitive Frameworks
An excellent place to live Canada 35 Canada Provides: Excellent economic fundamentals Excellent economic fundamentals Easy access to markets A cost-competitive business environment
Canada 36 …and a Safe and Just Society • Canada tops the G-7 as a safe place to live and conduct business. • Canada also ranks well in providing equal opportunities for individuals. * Confidence that person and property is protected. Rank among 49 countries considered in the 2002 World Competitiveness Yearbook. Source: IMD * Race, gender, family background does not pose a handicap for competitiveness. Rank among 49 countries considered in the 2002 World Competitiveness Yearbook Source: IMD
Canada 37 Canada Offers Much • Canada's economic fundamentals are excellent — government policies are geared toward competitiveness. • Canada provides assured access to the world's richest economy, in addition to having a large and growing domestic market of its own. • Canada provides a cost-competitive and future-oriented environment for business: • quality, productive workers; • a competitive tax system; • prime locations for R&D activities; • abundant energy at low prices; and • an excellent infrastructure. • Canada is an outstanding place to live, invest and do business.