Data Distributions: Understanding Mean, Median, Mode, and Range
220 likes | 257 Vues
Learn to decode data distributions by exploring mean, median, mode, and range with helpful examples and practical applications.

Data Distributions: Understanding Mean, Median, Mode, and Range
E N D
Presentation Transcript
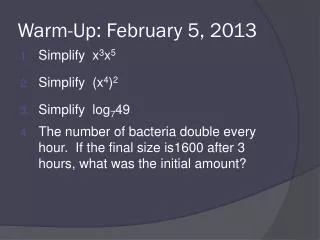
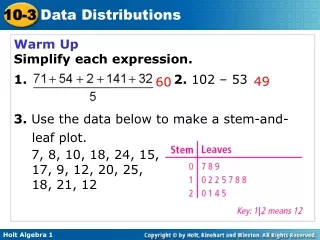
Warm Up Simplify each expression. 1. 2. 102 – 53 3. Use the data below to make a stem-and-leaf plot. 7, 8, 10, 18, 24, 15, 17, 9, 12, 20, 25, 18, 21, 12 49 60
10-3 Data Distributions Holt Algebra 1
The mean is the sum of the values in the set divided by the number of values in the set. • The median the middle value when the values are in numerical order, or the mean of the two middle values if there are an even number of values. • The mode is the value or values that occur most often. There may be one mode or more than one mode.. The range of a set of data is the difference between the least and greatest values in the set.
mean: median: 2, 4, 5, 7, 10 The median is 5. Example 1A: Finding Mean, Median, Mode, and Range of a Data Set Find the mean, median, mode, and range of the data set. The number of hours students spent on a research project: 2, 4, 10, 7, 5 Write the data in numerical order. Add all the values and divide by the number of values. There are an odd number of values. Find the middle value. mode: none No value occurs more than once. range: 10 – 2 = 8
median: 12, 12, 14, 17, 18, 18 mean: The median is 15 . Check It Out! Example 1c Find the mean, median, mode, and range of the data set. 12, 18, 14, 17, 12, 18 mode: 12, 18 range: 18 – 12 = 6
A value that is very different from other values in the set is called an outlier..
Example 2: Choosing a Measure of Central Tendency Rico scored 74, 73, 80, 75, 67, and 55 on six history tests. Use the mean, median, and mode of his scores to answer each question. mean ≈ 70.7 median = 73.5 mode = none A. Which value gives Rico’s test average? The average of Rico’s scores is the mean, 70.7. B. Which values best describes Rico’s scores? Median; most of his scores are closer to 73.5 than to 70.6. The mean is lower than most of Rico’s scores because he scored a 55 on one test. Since there is no mode, it is not a good description of the data.
Quartiles divide a data set into four equal parts. Each quartile contains one-fourth of the values in the set. The interquartile range (IQR) is the difference between the upper and lower quartiles. The IQR represents the middle half of the data.
A box-and-whisker plot can be used to show how the values in a data set are distributed. The minimum is the least value that is not an outlier. The maximum is the greatest value that is not an outlier. You need five values to make a box-and-whisker plot: the minimum, first quartile, median, third quartile, and maximum.
Helpful Hint Mathematically, any value that is 1.5(IQR) less than the first quartile or 1.5(IQR) greater than the third quartile is an outier.
Example 3: Sports Application The number of runs scored by a softball team at 19 games is given. Use the data to make a box-and-whisker plot. 3, 8, 10, 12, 4, 9, 13, 20, 12, 15, 10, 5, 11, 5, 10, 6, 7, 6, 11 Step 1 Order the data from least to greatest. 3, 4, 5, 5, 6, 6, 7, 8, 9, 10, 10, 10, 11, 11, 12, 12, 13, 15, 20 Step 2 Identify the five needed values and determine whether there are any outliers.
Minimum Maximum Q2 Q3 Q1 6 10 12 20 3 1.5(6) = 9 IQR: 12 – 6 = 6 Example 3 Continued 3, 4, 5, 5, 6, 6, 7, 8, 9, 10, 10, 10, 11, 11,12, 12, 13, 15, 20 12 +9 =21 6 –9 =–3 No values are less than –3 or greater than 21, so there are no outliers.
First quartile Third quartile Minimum Maximum Median ● ● ● ● ● 0 8 16 24 Example 3 Continued Half of the scores are between 6 and 12 runs per game. One-fourth of the scores are between 3 and 6. The greatest score earned by this team is 20.
Check It Out! Example 3 Use the data to make a box-and-whisker plot. 13, 14, 18, 13, 12, 17, 15, 12, 13, 19, 11, 14, 14, 18, 22, 23 Step 1 Order the data from least to greatest. 11, 12, 12, 13, 13, 13, 14, 14, 14, 15, 17, 18, 18, 19, 22, 23 Step 2 Identify the five needed values and determine whether there are any outliers.
Minimum Maximum Q2 Q3 Q1 13 14 18 23 11 1.5(5) = 7.5 IQR: 18 – 13 = 5 Check It Out! Example 3 Continued 11, 12, 12, 13, 13, 13, 14, 14, 14, 15, 17, 18, 18, 19,22, 23 18 +7.5 =25.5 13 –7.5 =5.5 No values are less than 5.5 or greater than 25.5, so there are no outliers.
First quartile Third quartile Maximum Minimum Median ● • • • • 8 16 24 Check It Out! Example 3 Continued Half of the data are between 13 and 18. One-fourth of the data are between 11 and 13. The greatest value is 23.
Lesson Quiz: Part I 1. Find the mean, median, mode, and range of the data set. The number of hours Gerald mowed lawns in one week: 7, 3, 5, 4, 5 mean: 4.8; median: 5; mode: 5; range: 4
Lesson Quiz: Part II The following list gives times of Tara’s one-way ride to school (in minutes) for one week: 12, 23, 13, 14, 13. Use the mean, median, and mode of her times to answer each question. mean = 15 median = 13 mode = 13 2. Which value describes the time that occurred most often? mode, 13 3. Which value best describes Tara’s ride time? Explain. Median or mode: 13; 13 occurred twice, and most times are near this value.
28 15.5 22.5 11 32 Lesson Quiz: Part III 4. The number of inches of snow that fell during the last 8 winters in one city are given. Use the data to make a box-and-whisker plot. 25, 17, 14, 27, 20, 11, 29, 32
Warm-Up 1. Find the mean, median, mode, and range of the data set. The number of hours Gerald mowed lawns in one week: 7, 3, 5, 4, 5 mean: 4.8; median: 5; mode: 5; range: 4