Main Sequence Stars and their Lifetimes
130 likes | 395 Vues
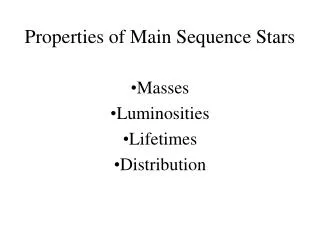
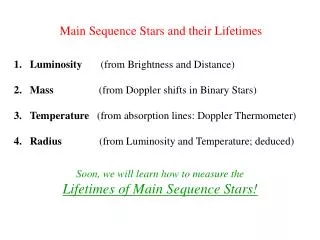
Main Sequence Stars and their Lifetimes. Luminosity (from Brightness and Distance) Mass (from Doppler shifts in Binary Stars) Temperature (from absorption lines: Doppler Thermometer) Radius (from Luminosity and Temperature; deduced).

Main Sequence Stars and their Lifetimes
E N D
Presentation Transcript
Main Sequence Stars and their Lifetimes • Luminosity (from Brightness and Distance) • Mass (from Doppler shifts in Binary Stars) • Temperature (from absorption lines: Doppler Thermometer) • Radius (from Luminosity and Temperature; deduced) Soon, we will learn how to measure the Lifetimes of Main Sequence Stars!
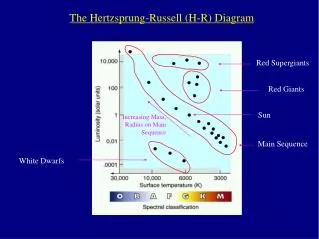
HR Diagram for Stars big & cool big & hot Units Of Sun’s radius small & hot small & cool
Luminosity, L, depends upon • Surface flux, F • Total Surface Area L = AreaxFlux Surface flux, F, is the light energy radiated from every unit area of the stars surface, it is temperature dependent (i.e. blackbody spectrum) Flux ~ T 4 Surface area is radius dependent Area = R2 We have L ~ R2T 4
Main Sequence Mass Relationship As temperature increases, mass increases! As mass increases, luminosity increases! L = M3.5
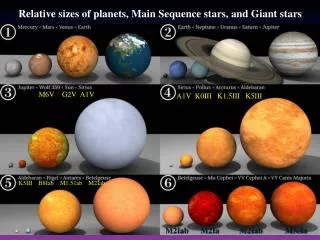
Main Sequence is O, B, A, F, G, K, M increasing temperature decreasing temperature increasing size decreasing size increasing mass decreasing mass increasing luminosity decreasing luminosity This applies to the Main Sequence Only Other Luminosity Classes do NOT obey all these trends.
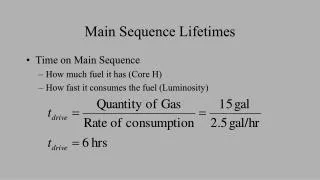
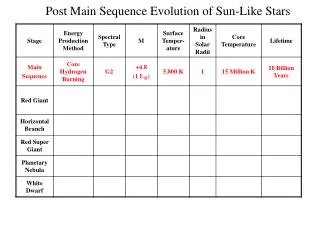
The Life Expectancies of Main Sequence Stars, Part 1 BASIC PRINCIPLES OF LIFETIMES The more fuel; the longer the life time… The slower the consumption of fuel, the longer the life time… Amount of Fuel Lifetime = Rate of Fuel Consumption The Amount of Fuel is proportional to the star’s mass, M The Rate of Fuel Consumption is proportional to the star’s luminosity, L The luminosity depends upon mass! L = M3.5
The Life Expectancies of Main Sequence Stars, Part 2 Therefore, the lifetime can be written using only the star’s mass! If we write the mass in solar units, then the lifetime is given in solar lifetimes. The sun’s lifetime is roughly 10 billion years, or Lifetime = 10 x 109 yr Large Mass Stars Have Shorter Lives M M 1 Lifetime ~ = = L M3.5 M2.5 M 0.5 solar mass star lives 5-6 solar life times, or 56 x 109 years A 4.0 solar mass star lives 0.031 solar life times, or 310 x 106 years O 40.0 solar mass star lives 0.0001 solar life times, or 1 x 10⁶ years
Main Sequence is O, B, A, F, G, K, M increasing temperature decreasing temperature increasing size decreasing size increasing mass decreasing mass increasing luminosity decreasing luminosity decreasing lifetime increasing lifetime This applies to the Main Sequence Only Other Luminosity Classes do NOT obey all these trends. The most massive stars live short lifetimes.
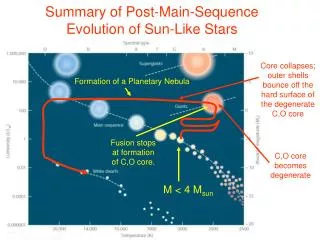
Evolutionary Tracks When Main Sequence Stars are newly born they are called Zero Age Main Sequence stars. (the red line on the graph) As they convert hydrogen to helium in their cores, their temperatures decrease and their luminosities increase slightly. This is due to an increase in the stars’ radii. This moves the star to the upper right on the HR diagram as they age. The “path of migration” on the HR diagram is called an evolutionary track. Zero Age Main Sequence