Download
1 / 21
250 likes | 384 Vues
Learn about non-parametric tests in data analysis, including Chi-Square test, one-way and two-way tests, interpretation of results, and examples. Discover when to use non-parametric tests over parametric tests and how to calculate and interpret Chi-Square statistics.

E N D
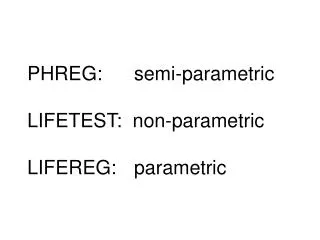
Chapter 9: Non-parametric Tests • Parametric vs Non-parametric • Chi-Square • 1 way • 2 way
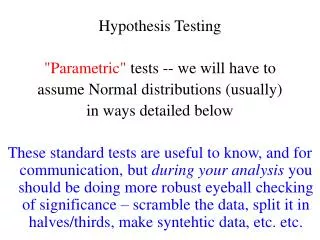
Parametric Tests • Data approximately normally distributed. • Dependent variables at interval level. • Sampling random • t - tests • ANOVA
Non-parametric Tests • Do not require normality • Or interval level of measurement • Less Powerful -- probability of rejecting the null hypothesis correctly is lower. So use Parametric Tests if the data meets those requirements.
One-Way Chi Square Test • Compares observed frequencies within groups to their expected frequencies. • HO = “observed” frequencies are not different from the “expected” frequencies. • Research hypothesis: They are different.
Chi Square Statistic • fo= observed frequency • fe = expected frequency
One-way Chi Square • Calculate the Chi Square statistic across all the categories. • Degrees of freedom = k - 1, where k is the number of categories. • Compare value to Table of Χ2.
One-way Chi Square Interpretation • If our calculated value of chi square is less than the table value, accept or retain Ho • If our calculated chi square is greater than the table value, reject Ho • …as with t-tests and ANOVA – all work on the same principle for acceptance and rejection of the null hypothesis
Two-Way Chi Square • Review cross-tabulations (= contingency tables) from Chapter 2. • Are the differences in responses of two groups statistically significantly different? • One-way = observed vs expected • Two-way = one set of observed frequencies vs another set.
Two-way Chi Square • Comparisons between frequencies (rather than scores as in t or F tests). • So, null hypothesis is that the two or more populations do not differ with respect to frequency of occurrence. • rather than working with the means as in t test, etc.
Two-way Chi Square Example • Null hypothesis: The relative frequency [or percentage] of liberals who are permissive is the same as the relative frequency of conservatives who are permissive. • Categories (independent variable) are liberals and conservatives. Dependent variable being measured is permissiveness.
Two-Way Chi Square Example • Because we had 20 respondents in each column and each row, our expected values in this cross-tabulation would be 10 cases per cell. • Note that both rows and columns are nominal data -- which could not be handled by t test or ANOVA. Here the numbers are frequencies, not an interval variable.
Two-Way Chi Square Example • Unfortunately, most examples do not have equal row and column totals, so it is harder to figure out the expected frequencies.
Two-Way Chi Square Example • What frequencies would we see if there were no difference between groups (if the null hypothesis were true)? • If 25 out of 40 respondents(62.5%) were permissive, and there were no difference between liberals and conservatives, 62.5% of each would be permissive.
Two-Way Chi Square Example • We get the expected frequencies for each cell by multiplying the row marginal total by the column marginal total and dividing the result by N. • We’ll put the expected values in parentheses.
Two-Way Chi-Square Example • So the chi square statistic, from this data is • (15-12.5)squared / 12.5 PLUS the same values for all the other cells • = .5 + .5 + .83 + .83 = 2.66
Two-Way Chi-Square Example • df = (r-1) (c-1) , where r = rows, c =columns so df = (2-1)(2-1) = 1 • From Table C, α = .05, chi-sq = 3.84 • Compare: Calculate 2.66 is less than table value, so we retain the null hypothesis.
Chapter 9: Non-parametric Tests • Review Parametric vs Non-parametric • Be able to calculate: • Chi-Square (obs-exp2 ) / exp • 1 way • 2 way • (row total) x (column total) / N = expected value for that cell • calculate chi-square and compare to table.