Download
1 / 16
450 likes | 2.36k Vues
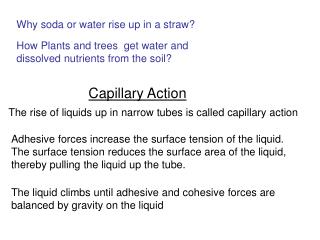
Capillary Pressure and Saturation History Capillary Pressure in Reservoir Rock. DRAINAGE AND IMBIBITION CAPILLARY PRESSURE CURVES. DRAINAGE Fluid flow process in which the saturation of the nonwetting phase increases IMBIBITION

E N D
Capillary Pressure and Saturation History Capillary Pressure in Reservoir Rock
DRAINAGE AND IMBIBITION CAPILLARY PRESSURE CURVES • DRAINAGE • Fluid flow process in which the saturation of the nonwetting phase increases • IMBIBITION • Fluid flow process in which the saturation of the wetting phase increases Drainage Pc Saturation History - Hysteresis - Capillary pressure depends on both direction of change, and previous saturation history - Blue arrow indicates probable path from drainage curve to imbibition curve at Swt=0.4 - At Sm, nonwetting phase cannot flow, resulting in residual nonwetting phase saturation (imbibition) - At Swi, wetting phase cannot flow, resulting in irreducible wetting phase saturation (drainage) Pd Imbibition Swi Sm 0 0.5 1.0 Sw Modified from NExT, 1999, after …
Saturation History • The same Pc value can occur at more than one wetting phase saturation
Rock Type • Rock Type (Archie’s Definition - Jorden and Campbell) • Formations that “... have been deposited under similar conditions and ... undergone similar processes of later weathering, cementing, or re-solution....” • Pore Systems of a Rock Type (Jorden and Campbell) • “A given rock type has particular lithologic (especially pore space) properties and similar and/or related petrophysical and reservoir characteristics”
Thomeer’s Parameters for Capillary Pressure Curves • Thomeer’s Data • Mercury Injection - drainage • Very high capillary pressures • (Vb)P The (assymptotically approached) fraction of bulk volume occupied by mercury at infinite capillary pressure (similar to previous parameter, irreducible wetting phase saturation) • Pd Displacement Pressure, capillary pressure required to force nonwetting phase into largest pores (same as previously discussed) • G Parameter describing pore-size distribution (similar to previous parameter, 1/. Increasing G (or decreasing ), suggests poor sorting, and/or tortuous flow paths)
Figures 2.4 and 2.5 • (Vb)p = is the fractional volume occupied by Hg at • infinite pressure, or total interconnected pore volume. • pdis the extrapolated Hg displacement pressure (psi); • pressure required to enter largest pore throat. • Gis pore geometrical • factor; range in size and • tortuosity of pore throats. PT = PORE THROAT P - PORE • Large pd = small pore thorats • Large G = tortuous, poorly • sorted pore thorats . Modfied from Jordan and Campbell, 1984, vol. 1
Note variation in pore properties and permeability within a formation Modfied from Jordan and Campbell, 1984, vol. 1
Figure 2.8 size: lower fine sorting: very well sorted Modfied from Jordan and Campbell, 1984, vol. 1
Figure 2.9 size: lower fine sorting: moderately sorted Modfied from Jordan and Campbell, 1984, vol. 1
Figure 2.10 size: upper very fine sorting: moderately sorted Modfied from Jordan and Campbell, 1984, vol. 1
Figure 2.11 -effect of significant cementing and clay Modfied from Jordan and Campbell, 1984, vol. 1
Figure 2.12 Effect of Dispersed Clays Modfied from Jordan and Campbell, 1984, vol. 1; after Neasham, 1977
Capillary Pressure in Reservoirs A B dpw=wg/D dh dpo=og/D dh Free Water Level Reservoir, o Pc = po-pw = 0 Depth 3 2 1 Aquifer, w Pressure
Fault Capillary pressure difference between gas and oil phases in core ‘B’ Pc,go = h2g (ro-rg) Gas & Water Gas density = rg Seal ‘B’ h2 Oil, Gas & Water Free Oil Level ‘A’ Oil & Water h1 Oil density = ro Free Water Level Water Capillary pressure difference between oil and water phases in core ‘A’ Pc,ow = h1g (rw-ro) Water density = rw Modified from NExT, 1999, modified after Welge and Bruce, 1947 Fluid Distribution in Reservoirs
RELATION BETWEEN CAPILLARY PRESSURE AND FLUID SATURATION J-Function- for k,f Lab Data -Lab Fluids: s, -Core sample: k, Height Above Free Water Level (Feet) Reservoir Data J-Function Pc Pc Pd Oil-Water contact Pd Hd 0 Free Water Level 0 50 100 0 50 100 0 0 50 100 Sw (fraction) Sw (fraction) Sw (fraction) Modified from NExT, 1999, after …
Saturation in Reservoir vs. Depth • Results from two analysis methods (after ABW) • Laboratory capillary pressure curve • Converted to reservoir conditions • Analysis of well logs • Water saturation has strong effect on resistivity curves (future topic)