U.S. Imports: A Comparative Analysis of World Areas and Selected Countries (2001 vs. 2012)
This data post from the Federal Reserve Bank of San Francisco examines the significant trends in U.S. imports from 2001 to 2012, highlighting customs value totals in billions. Notably, imports from China surged by 316%, increasing from $102 billion in 2001 to $426 billion in 2012. The report provides insights into changes in import values from various countries and regions, alongside questions for analysis and educational purposes. For further exploration, visit FRBSF.org for additional trade data and resources.


U.S. Imports: A Comparative Analysis of World Areas and Selected Countries (2001 vs. 2012)
E N D
Presentation Transcript
Trade PatternsU.S. imports Date last updated: September 9, 2013 DataPost Federal Reserve Bank of San Francisco Economic Education Group
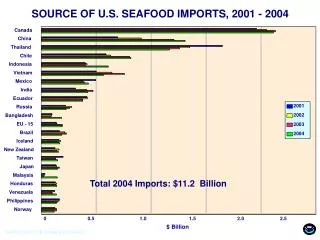
U.S. Imports by World Area and Selected Countries2001 vs. 2012 Customs Value Totals ($billions) DataPost http://www.frbsf.org/education/teachers/datapost/index.html FRBSF Economic Education Group
Annotated Chart NotesU.S. Imports by World Area and Selected Countries2001 vs. 2012 Customs Value Totals ($billions) For imports, the value reported is the U.S. Customs and Border Protection appraised value of merchandise Import values from China increased 316% from 2001 to 2012 =100 x (425.5789-102.2784) 102.2784 China: $102b in 2001 $426b in 2012 Source: Census Bureau & FRBSF Calculations Note: Data are calendar-year totals of monthly, non-seasonally adjusted values See PowerPoint file for country definitions and data source DataPost http://www.frbsf.org/education/teachers/datapost/index.html FRBSF Economic Education Group
What Do You Think? • How would you describe the change in Japanese import totals from 2001 to 2012? (See slide 2) • Imports from China increased 316% from 2001 to 2012. Over the same time comparison, what is the percent change for the category “Rest of the World”? (See slide 3) • For any world area or country shown, did imports show a decrease in value from 2001 to 2012? (See slide 3) • What were the top three sources of U.S. imports in 2001? In 2012? (See slide 2) Visit FRBSF.org to learn more about U.S. trade. DataPost http://www.frbsf.org/education/teachers/datapost/index.html FRBSF Economic Education Group