Download
1 / 38
380 likes | 503 Vues
TPB SCENARIO STUDY. Progress on “CLRP Aspirations” & “What Would it Take?” Scenarios. Monica Bansal and Michael Eichler Department of Transportation Planning Presentation to the TPB Scenario Study Task Force September 17, 2008. The Two New Scenarios. CLRP Aspirations.

E N D
TPB SCENARIO STUDY Progress on “CLRP Aspirations” & “What Would it Take?” Scenarios Monica Bansal and Michael Eichler Department of Transportation Planning Presentation to the TPB Scenario Study Task Force September 17, 2008
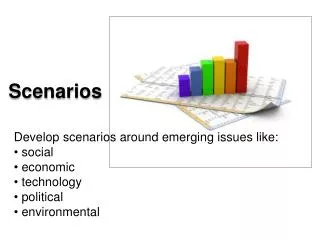
The Two New Scenarios CLRP Aspirations What Would it Take? Draws on past scenarios (5 transportation/land use scenarios and 2 value pricing scenarios) to provide an ambitious yet attainable vision of land use and transportation for the 2010 CLRP update. Starts with CO2 goals (80% below 2005 levels in 2050 and 20% reduction by 2020) and assesses what scales and combinations of interventions will be necessary to achieve the goal.
Developing the Scenarios CLRP Aspirations 1. Transportation Component 2. Land Use Component WWIT 3. Evaluation of WWIT Strategies
Developing the CLRP Aspirations Scenario 4 principles of RMAS • Bring people closer to their jobs, thereby reducing their commuting distance • Create a balance between the number of workers and jobs available in the region • Land use shifts should push the boundaries of current zoning and comprehensive plan restrictions, while insuring that changes remain feasible • Land use changes should be supported by high quality transportation infrastructure.
CLRP Aspirations The Transportation Component
Regional Activity Centers Many activity centers are not served by the Metrorail system
CLRP Major Transit Projects ICC Bus Service The CLRP already contains many major transit projects, many of which provide service to activity centers. Bi-County Transitway Corridor Cities Transitway K Street Busway Dulles Metrorail Columbia Pike Streetcar Anacostia Streetcar Crystal City/Potomac Yard Transitway Shirley Highway Bus Service
RMAS Transit Projects I-270 Transitway Georgia Ave Transitway US 1 Transitway to Kontera RMAS evaluated many additional new transit routes. Greenbelt Rd. Transitway US 50 Transitway Orange Line Extension MD 201 Transitway Extend Purple Line to Branch Ave VRE Extension to Haymarket Extend Yellow Line to Branch Ave Columbia Pike Transitway Pennsylvania Ave to Andrews AFB US 1 Transitway VRE Extension to Fauquier Co. MD 5/US 301 Transitway MD 210 Transitway
Other studied major transit projects County and sub-regional plans include even more transit. North Bethesda Transitway Metrorail, Dunn Loring to Bethesda Route 28 LRT Duke Street BRT Metrorail to Potomac Mills Van Dorn Street BRT
DC rail projects: WMATA and DCAA New Blue Line: Rosslyn to Stadium/Armory WMATA core capacity studies state need for a new river crossing from a new Rosslyn station into Georgetown, where a new Blue line would run along M St. The DC alternatives analysis study proposed three major streetcar routes in DC Two infill stations are being considered in Alexandria DC Streetcar Routes Potomac Yard Infill Station Eisenhower Valley Infill Station
Studied Network of Variably Priced Lanes (VPLs) TPB Recently evaluated a network of variably priced lanes (VPLs) which could be used for high-quality bus transit service.
Studied Network of Variably Priced Lanes with Activity Centers The studied network of VPLs provides access nearly all activity centers not currently served or planned to be served by high quality transit.
Interaction With Regional Studies • The studied variably priced lanes network can inform other studies throughout the region, including: • West Side Mobility Study (I-270 and Legion Bridge) • MD Capital Beltway Study • South Side Mobility Study (Including Wilson Bridge) • I-66 Corridor Study MD Capital Beltway Study West Side Mobility Study 14th Street Bridge Study I-66 Corridor Study Capital Beltway HOT Lanes South Side Mobility Study Shirley Highway HOT Lanes
Additional Rationale for Bus Service on Variably Priced Lanes I-270 Transitway In addition to providing transit access to activity centers, high-quality bus service on VPLs can be a low-cost alternative to other planned dedicated-ROW transit services along many of the region’s growing corridors. VPLs can also provide “dedicated right-of-way” to other planned express and rail relief routes bus routes. US 50 Transitway Metrorail, Dunn Loring to Bethesda VA 28 LRT Extend Purple Line to Branch Ave Extend Yellow Line to Branch Ave Orange Line Extension Pennsylvania Ave to Andrews AFB Metrorail to Potomac Mills MD 5/US 301 Transitway MD 210 Transitway
Potential Bus Station Locations Buses can stop at stations located in activity centers, park and ride lots and existing Metrorail stations via dedicated access ramps Bus routes on VPLs can provide low-cost but high-quality transit to activity centers without transit service.
Airport/Monocacy Blvd. Service to the City of Frederick Wheaton New/updated activity centers Connections through downtown 7th/9th Sts. Circulation within activity centers H/I Sts. Westphalia Ft. Belvoir Comments Received Include WMATA Priority Corridors
Potential Bus Routes • VPL Network can be segmented into a series of transit lines: • Beltway • Outer Beltway • I-270/MD 5 • I-95 • I-295/MD 210 • US-50/I-66 • Dulles Corridor excluded to prevent redundancy with Metrorail extension
Bus Service on Variably Priced Lanes • Previous pricing study evaluated regular and express bus service operating on the variably priced lanes • CLRP Aspirations Scenario to include BRT-like bus stations and technologies at high-demand locations The Shirlington Transit Station, currently under construction in Arlington, VA.
In addition to the BRT network, what other projects should be included in the scenario? Should the BRT network provide downtown distributor service, or simply feed Metrorail? How would downtown distribution work? - Dedicated bus lanes or mixed use roads? Questions for Consideration
Solicit further feedback from the Task Force and Regional Bus Subcommittee Incorporate comments Code network and begin analysis Next Steps
CLRP Aspirations The Land Use Component
Household Growth Shifts 2010-2030
Employment Growth Shifts 2010-2030
Comments Received/Next Steps RMAS assumptions are outdated New growth estimates New activity centersShould all RMAS scenarios be included? Are the shifts aggressive enough?
What Would It Take Developing and Analyzing the Scenario
Setting up the WWIT Scenario Goal:To reduce CO2 emissions by 10%, 20% and 80% below 2005 levels in 2012, 2020 and 2050 respectively 3 categories of strategies to reduce mobile CO2 emissions Fuel Efficiency Fuel Carbon Intensity Travel Efficiency Reduce VMT through changes in land use, travel behavior, prices Reduce congestion Improve operational efficiency Beyond CAFE standards [currently 35 mpg by 2020] Alternative fuels (biofuels, hydrogen, electricity) Vehicle technology (hybrid engine technology)
Analyzing the WWIT Scenario 3 categories of analysis for each strategy • Effectiveness • Cost-effectiveness • Timeframe for Implementation
Effectiveness What can we accomplish by reducing congestion? Source: University of California, Riverside
Cost-effectiveness How can we begin to prioritize strategies? Initial analysis of cost-effectiveness of Transportation Emissions Reduction Measures ($ per ton of CO2 reduced)
Timeframe for Implementation Early action is essential to meet the goals Transportation Sector Emissions Example Reductions for Measures If we begin reducing in 2020 or 2030 rather than steadily reducing now, we will not reduce the same level of cumulative emissions as may be needed.
Connecting the Two Scenarios Comprehensive cost-benefit analysis to compare alternatives[including transit, highway, and “nonstructural” approaches—such as congestion pricing, parking policies and technology based investments]Benefits include mobility, congestion management, economic developmentSeek a mix of investments (from both scenarios) most likely to deliver maximum net economic value