Download
1 / 27
270 likes | 284 Vues
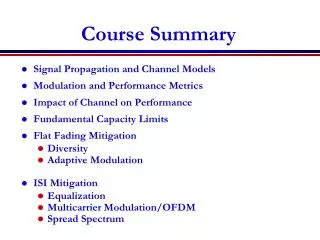
This summary covers various topics related to food chains, cell quota, reserve dynamics, metabolic rates, homeostasis, and growth in the context of Energy Budget Theory. It provides insights into the allocation of resources, metabolic processes, and the relationship between surface area and volume in organisms.

E N D
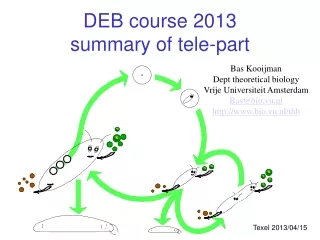
DEB course 2013summary of tele-part Bas Kooijman Dept theoretical biology Vrije Universiteit Amsterdam Bas@bio.vu.nl http://www.bio.vu.nl/thb Texel 2013/04/15
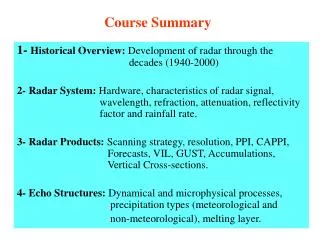
Food chains n=2 9.3.1b glucose mg/ml Escherichia coli mm3/ml cell vol, m3 h = 0.064 h-1, Xr = 1mg ml-1, 25 °C Data from Dent et al 1976 Dictyostelium mm3/ml cell vol, m3 Kooijman & Kooi,1996 Nonlin. World3: 77 - 83 time, h time, h
Growth on reserve Conc. potassium, mM Optical Density at 540 nm time, h Potassium limited growth of E. coli at 30 °C Data Mulder 1988; DEB model fitted OD increases by factor 4 during nutrient starvation internal reserve fuels 9 hours of growth
Yield vs growth 4.3.1h Streptococcus bovis, Russell & Baldwin (1979) Marr-Pirt (no reserve) DEB 1/yield, mmol glucose/ mg cells spec growth rate yield 1/spec growth rate, 1/h Russell & Cook (1995): this is evidence for down-regulation of maintenance at high growth rates DEB theory: high reserve density gives high growth rates structure requires maintenance, reserves do not
Cell quota Droop’s model • Droop → DEB • quota → structure + reserve • static → dynamic • include maintenance • population → individual • V1- → iso-morph subsistence quota 540 molecules/cell Vitamin B12 limited growth of Monochrysis lutheri Droop 1968 J Mar Biol Assoc UK48: 689-733
Embryonic development 2.6.2d Crocodylus johnstoni, Data: Whitehead 1987 embryo yolk O2 consumption, ml/h weight, g time, d time, d
Storage Plants store water and carbohydrates, Animals frequently store lipids Many reserve materials are less visible specialized Myrmecocystus serves as adipose tissue for the ant colony
Migration: metabolic memory 1.1.3b Some populations of humpback whale Megaptera novaeangliae (36 Mg) migrate 26 Mm anually without feeding, A 15 m mother gets a 6 m calf in tropical waters, gives it 600 l milk/d for 6 months and together return to cold waters to resume feeding in summer
Product Formation According to Dynamic Energy Budget theory: Product formation rate = wA. Assimilation rate + wM. Maintenance rate + wG . Growth rate For pyruvate: wG<0 ethanol pyruvate, mg/l pyruvate glycerol, ethanol, g/l glycerol throughput rate, h-1 Glucose-limited growth of Saccharomyces Data from Schatzmann, 1975
Method of indirect calorimetry 4.8.2 Empirical origin (multiple regression): Lavoisier 1780 Heat production = wC CO2-production + wO O2-consumption + wN N-waste production DEB-explanation: Mass and heat fluxes = wA assimilation + wD dissipation + wG growth Applies to CO2, O2, N-waste, heat, food, faeces, … For V1-morphs: dissipation maintenance
Metabolic rate 8.2.2e slope = 1 Log metabolic rate, w O2 consumption, l/h 2 curves fitted: endotherms 0.0226 L2 + 0.0185 L3 0.0516 L2.44 ectotherms slope = 2/3 unicellulars Log weight, g Length, cm Intra-species Inter-species (Daphnia pulex) Data: Richman 1958; curve fitted from DEB theory Data: Hemmingson 1969; curve fitted from DEB theory
Homeostasis strong constant composition of pools (reserves/structures) generalized compounds, stoichiometric contraints on synthesis weak constant composition of biomass during growth in constant environments determines reserve dynamics (in combination with strong homeostasis) structural constant relative proportions during growth in constant environments isomorphy .work load allocation thermal ectothermy homeothermy endothermy acquisition supply demand systems; development of sensors, behavioural adaptations
-rule for allocation Ingestion Respiration Ingestion rate, 105 cells/h O2 consumption, g/h Length, mm Length, mm Length, mm Reproduction Cum # of young • large part of adult budget • to reproduction in daphnids • puberty at 2.5 mm • No change in • ingest., resp., or growth • Where do resources for • reprod. come from? Or: • What is fate of resources • in juveniles? Growth: Von Bertalanffy Age, d Age, d
Kooijman 2013 Oikos122: 348-357 Waste to hurry • Exploiting blooming resources • requires blooming yourself • high numerical response • short life cycle • small body size • fast reproduction • fast growth • high feeding rate • -rule explains why • [pM] needs to be high • Ecosystem significance: • flux through basis food pyramid
Surface area/volume interactions • biosphere: thin skin wrapping the earth • light from outside, nutrient exchange from inside is across surfaces • production (nutrient concentration) volume of environment • food availability for cows: amount of grass per surface area environment • food availability for daphnids: amount of algae per volume environment • feeding rate surface area; maintenance rate volume (Wallace, 1865) • many enzymes are only active if linked to membranes (surfaces) • substrate and product concentrations linked to volumes • change in their concentrations gives local info about cell size • ratio of volume and surface area gives a length
Change in body shape Isomorph: surface area volume2/3 volumetric length = volume1/3 Mucor Ceratium Merismopedia V0-morph: surface area volume0 V1-morph: surface area volume1
Isomorphic growth 2.6c diameter, m Weight1/3, g1/3 Amoeba proteus Prescott 1957 Saccharomyces carlsbergensis Berg & Ljunggren 1922 time, h time, h Weight1/3, g1/3 Toxostoma recurvirostre Ricklefs 1968 length, mm Pleurobrachia pileus Greve 1971 time, d time, d
Mixtures of V0 & V1 morphs 4.2.3a volume, m3 hyphal length, mm Bacillus = 0.2 Collins & Richmond 1962 Fusarium = 0 Trinci 1990 time, min time, h volume, m3 volume, m3 Escherichia = 0.28 Kubitschek 1990 Streptococcus = 0.6 Mitchison 1961 time, min time, min
Mixtures of changes in shape 2 Dynamic mixtures between morphs V1- V0-morph outer annulus behaves as a V1-morph, inner part as a V0-morph. Result: diameter increases time Lichen Rhizocarpon V1- iso- V0-morph
Flux vs Concentration • concept “concentration” implies • spatial homogeneity (at least locally) • biomass of constant composition for intracellular compounds • concept “flux” allows spatial heterogeneity • classic enzyme kinetics relate • production flux to substrate concentration • Synthesizing Unit kinetics relate • production flux to substrate flux • in homogeneous systems: flux conc. (diffusion, convection) • concept “density” resembles “concentration” • but no homogeneous mixing at the molecular level • density = ratio between two amounts
Synthesizing units Are enzymes that follow classic enzyme kinetics E + S ES EP E + P With two modifications: back flux is negligibly small E + S ES EP E + P specification of transformation is on the basis of arrival fluxes of substrates rather than concentrations The concept concentration is problematic in spatially heterogeneous environments, such as inside cells In spatially homogeneous environments, arrival fluxes are proportional to concentrations
3 4 5 1 2 prokaryotes 7 plants 9 animals 6 8 Evolution of DEB systems variable structure composition strong homeostasis for structure increase of maintenance costs delay of use of internal substrates inernalization of maintenance installation of maturation program strong homeostasis for reserve Kooijman & Troost 2007 Biol Rev, 82, 1-30 reproduction juvenile embryo + adult specialization of structure
Symbiogenesis 2.7 Ga 2.1 Ga 1.27 Ga phagocytosis
Empirical patterns Feeding During starvation, organisms are able to reproduce, grow and survive for some time At abundant food, the feeding rate is at some maximum, independent of food density Growth Many species continue to grow after reproduction has started Growth of isomorphic organisms at abundant food is well described by the von Bertalanffy For different constant food levels the inverse von Bertalanffy growth rate increases linearly with ultimate length The von Bertalanffy growth rate of different species decreases almost linearly with the maximum body length Fetuses increase in weight approximately proportional to cubed time Reproduction Reproduction increases with size intra-specifically, but decreases with size inter-specifically Respiration Animal eggs and plant seeds initially hardly use O2 The use of O2 increases with decreasing mass in embryos and increases with mass in juveniles and adults The use of O2 scales approximately with body weight raised to a power close to 0.75 Animals show a transient increase in metabolic rate after ingesting food (heat increment of feeding) Stoichiometry The chemical composition of organisms depends on the nutritional status (starved vs well-fed) The chemical composition of organisms growing at constant food density becomes constant Energy Dissipating heat is a weighted sum of 3 mass flows: CO2, O2 and N-waste
Energy Budgets • Basic processes • Feeding • Digestion • Storing • Growth • Maturation • Maintenance • Reproduction • Product formation • Aging • All have ecological implications • All interact during the life cycle