Download
1 / 10
100 likes | 252 Vues
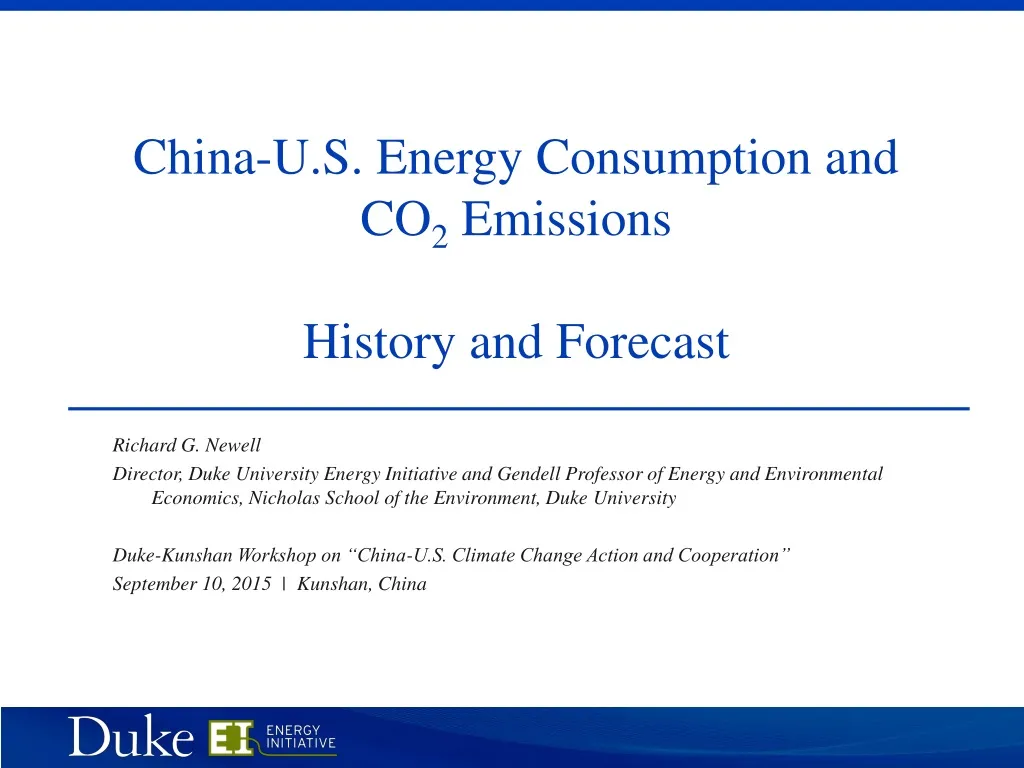
China-U.S. Energy Consumption and CO 2 Emissions History and Forecast. Richard G. Newell Director , Duke University Energy Initiative and Gendell Professor of Energy and Environmental Economics, Nicholas School of the Environment, Duke University

E N D
China-U.S. Energy Consumption and CO2 Emissions History and Forecast Richard G. Newell Director, Duke University Energy Initiative and Gendell Professor of Energy and Environmental Economics, Nicholas School of the Environment, Duke University Duke-Kunshan Workshop on “China-U.S. Climate Change Action and Cooperation” September 10, 2015 | Kunshan, China
Global CO2 emissions: different policy assumptions underlie different projections of world energy-related emissions Data source: Historical data from IEA Statistics until 2012. Projections from IEA World Energy Outlook (2014), U.S. EIA International Energy Outlook (2013), ExxonMobil Outlook for Energy (2015) and Shell New Lens Scenarios (2013). Richard Newell, 09/10/2015, Kunshan
Divergent CO2 emissions trajectories between U.S. and China Data source: Historical data are from IEA Statistics until 2012. Projections from IEA World Energy Outlook (2014), U.S. EIA International Energy Outlook (2013), ExxonMobil Outlook for Energy (2015). Richard Newell, 09/10/2015, Kunshan
U.S. climate target in the INDC • U.S. is the second largest GHG emitter after China, accounting for 16% of global emissions • U.S. pledges • Copenhagen: Reduce GHG emissions by 17% below 2005 level by 2020 • INDC: Reduce GHG emissions by 26-28% below 2005 level by 2025 • Consistent with a pathway to 80% or more reduction by 2050 • Measures proposed in INDC to achieve this target • Established domestic laws and regulations (Clean Air Act, Energy Policy Act, Energy Independence and Security Act, Fuel Economy Standards for certain vehicle types, Clean Power Plan) • Proposed but unfinalized regulations (including post-2018 heavy-duty vehicle fuel economy standards, more stringent code for buildings and appliances) • No intention to use international market mechanism to implement 2025 target Richard Newell, 09/10/2015, Kunshan
U.S. historical energy-related CO2 emissions and reduction targets Copenhagen target 17% below 2005 in 2020 INDC target 26-28% below 2005 in 2025 Data source: Historical data are from EIA International Statistics. Focused on CO2 only. Richard Newell, 09/10/2015, Kunshan
How can U.S. achieve its reduction target? 2007 EIA Reference Case Pre-recession, before EISA2007 was enacted 2010 EIA Reference Case Post-recession, includes EISA2007 and CAFE standards for MY2011-2016 CAFE standards MY2012-2016 ~200 Mt 2020 target -17% Total reduction ( 2025 target -26% Data source: Historical data from U.S. EIA International Statistics. Projection data from Reference Case of U.S. EIA’s AEO2007, 2010, 2012, 2015; CAFE Standards Case of AEO2012; and EIA’s Analysis of the Impacts of the Clean Power Plan (2015) Richard Newell, 09/10/2015, Kunshan
How can U.S. achieve its reduction target? 2010 EIA Reference Case Post-recession, includes EISA2007 and CAFE standards for MY2011-2016 2007 EIA Reference Case Pre-recession, before EISA2007 was enacted 2012 EIA Reference Case ~50 Mt EIA 2012 CAFE Case MY 2017-2025 Heavy duty vehicle standards 2014-2018 ~100 Mt EIA 2015 Reference Case EIA Clean Power Plan Base Case Scenario 2025 target Data source: Historical data from U.S. EIA International Statistics. Projections from Reference Case of EIA’s AEO2007, 2010, 2012, 2015; CAFE Standards Case of AEO2012; and EIA’s Analysis of the Impacts of the Clean Power Plan (2015) Richard Newell, 09/10/2015, Kunshan
2050 cost-effective mitigation opportunities in the U.S. ___________ Power Sector 64% _________ Data source: AMPERE Project __ End-use Sector __ 18% __ Energy Efficiency __ 18% Nuclear 12% Renewables 22% Carbon Capture & Storage 30% Richard Newell, 09/10/2015, Kunshan
2050 cost-effective mitigation opportunities in China Data source: AMPERE Project _____ Power Sector 54% ______ _ End-use Sector _ 16% ___ Energy Efficiency ____ 30% Nuclear 12% Renewables 20% Carbon Capture & Storage 18% Richard Newell, 09/10/2015, Kunshan
Richard Newell Duke University Energy Initiative energy.duke.edu richard.newell@duke.edu 919-681-8663 For more information Richard Newell, 09/10/2015, Kunshan