China and Its Impact on World Energy Consumption
China and Its Impact on World Energy Consumption. Dan Westbrook. Energy Consumption 2004. Energy Consumption vs. World Population. 2004 Energy Consumption. $GDP*/BOE. * 2004 GDP $PPP. Energy use grows with economic development. energy demand and GDP per capita (1980-2002). US. Australia.

China and Its Impact on World Energy Consumption
E N D
Presentation Transcript
China and Its Impact on World Energy Consumption Dan Westbrook
Energy Consumption vs. World Population 2004 Energy Consumption
$GDP*/BOE * 2004 GDP $PPP
Energy use grows with economic development energy demand and GDP per capita (1980-2002) US Australia France Russia S. Korea UK Japan Ireland Greece Malaysia Mexico China Brazil India • Source: UN and DOE EIA
Energy use grows with economic development energy demand and GDP per capita (1980-2002) US Australia France Russia S. Korea UK Japan Ireland Greece Malaysia Mexico 4x GDP / 2X Energy China Brazil India • Source: UN and DOE EIA
Issues Going Forward • Political unrest / security of supply • Growth in world economy, especially in India and China (and growth in overall population) • Environmental issues – carbon tax? • Development of new sources of energy
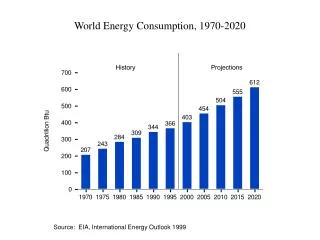
~ 23% of world’s primary energy comes from natural gas, 6% from Hydro, 6% from Nuclear, 28% from • Coal, and 36% from oil • Oil R/P is ~ 40 (and it has been ~ 40 for the last 10 years, was actually lower prior to that time • Gas R/P is ~ 65 (and has been over 60 for the last 20 years) • Coal R/P ~ 200 yr • Today – production is ~ 82 mmbod spare capacity is few % (1 to 1.5 mmbod) • Early 80’s production was ~ 60 mmbod spare capacity was on the order of 25% • On a real basis, using CPI as the adjustment, the peak price for oil was in 1979 when it was just • Almost $100/bbl • Average energy growth is just over 2% per year, average oil growth is just under 2% per year. • Main drivers for increase in price of oil: • Increased consumption – lower spare capacity • Geopolitical issues (Nigeria, Venezuela, Iraq, Iran • Hurricanes in 2005 • Oil as a financial instrument • World oil reserves have been increasing as far back as you go. Due to improved exploration and • Improved recovery • Carbon emissions up 4.8% in 2004, and 2.9% in 2005 • Oil inventories are actually above average since Jan05 • Refining capacity: global distillation usage was 86% in 2005, only 700,000 bod capacity added in • 2005 • Nuclear power plants: 4 new in 2005, 2 in Japan, 1 in Korea, 1 in India • Wind produced 0.7% of world’s electricity in 2005. BUT 30% growth / yr over last 10 years. US got • 0.4% of electricity from wind • Only about 20 to 25% of the worlds energy is used for transportation, more in developed countries, • Less in developing countries • 16: Hubbard prediction: somewhere between a few years and 20 (non-open) or 30 years (OPEC) • 17: CO2 atmospheric concenrtration was 280 ppm several hundred years ago, now 380 ppm