Download
1 / 23
230 likes | 477 Vues
TRANSPORT ENERGY CONSUMPTION AND CO 2 EMISSIONS IN BRAZIL. Helder Queiroz Pinto Jr, Federal University of Rio de Janeiro Natália Gonçalves de Moraes, Federal University of Rio de Janeiro. 34 th IAEE International Conference . TRANSPORT ENERGY CONSUMPTION AND CO 2 EMISSIONS IN BRAZIL. 1.

E N D
TRANSPORT ENERGY CONSUMPTION AND CO2 EMISSIONS IN BRAZIL Helder Queiroz Pinto Jr, Federal Universityof Rio de Janeiro Natália Gonçalves de Moraes, Federal Universityof Rio de Janeiro 34th IAEE International Conference
TRANSPORT ENERGY CONSUMPTION AND CO2 EMISSIONS IN BRAZIL 1 OVERVIEW 2 MAIN OBJECTIVES 3 METHODOLOGY 4 RESULTS 5 CONCLUSION
Overview and Context Since 1970`s: transport automobile (light fleet) by gasoline, ethanol, natural gas (diesel was not allowed) Brazil: fast growth of motorization rate during the last decade: forecasts of Ten-Year Energy Plan (PDE, 2019) show that this rate will rise from 136 to 192 vehicles per 1000 inhabitants between 2010 and 2019, which despite such growth, remains far from that of OECD countries. (EPE, 2010) Ethanol in the transport energy matrix: Crucial to reduce energy dependance after oil shocks. Is it important for CO2 emissions as well?
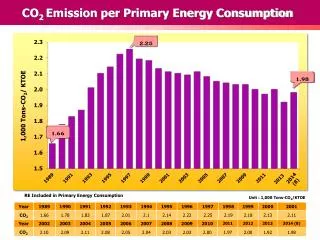
First Oil shock 1 Ethanol and Gasoline Demand in Brazil Anhydre Gasoline
2 Ethanol and Gasoline Demand in Brazil 95% of new cars: ethanol engines Hydr. Anhydre Gasoline
3 Ethanol and Gasoline Demand in Brazil Oil prices decreasing Hydrate Anhydre Gasoline
FLEX GN 4 Ethanol and Gasoline Demand in Brazil Hydraté Anhydre Gasoline
New car sales by fuel % gasoline ethanol flex fuel diesel ) Source: Smith C., 2010./ ANFAVEA, 2009.
Main Objectives • Examine the consumption of energy and its impacts 0n CO2 emissions in Brazil between 2010 and 2019, • Taking into account three cases of ethanol participation in the total fleet consumption. • (1) with structural changes of fleet: equal to the projections of the PDE 2009 and • (2) without structural change: fixed according to the market share of each type of vehicle verified in 2009. • (3) extreme case: ethanol prices are not competitive
Methodology • The data available in the Ten-Year Energy Plan 2019, published by EPE (2010) allows the calculation of both the average consumption of the light fleet by fuel (toe/ vehicle) and the development of motorization in Brazil during the period analyzed. • The following basic assumptions were adopted: • Brazil would reach the current motorization index’s of EU27, US and Japan according to a linear projection, in 2019. • The estimated consumption (toe/vehicle) is based on the evolution of car fleet (using a Gompertz function) and fuel demand forecasts ( PDE 2019). • The last step was to calculate the total CO2 emissions for each of the cases examined, according to the emissions rates published by EPE (2010) for the consumption of gasoline, natural gas and ethanol
Brazilian Car Fleet Scenarios • The Reference Scenario to the energy consumption and emissions in the passenger transport in Brazil: • Main parameters to forecast fuel demand (light vehicles): • GDP and its impact on light vehicles sales , • Consumer preference between gasoline and ethanol in the supply of flex fuel vehicles. • Results: Car Fleet increases from 24,8 millions of light vehicles, in 2009, to 39,7 millions of vehicles, in 2019. Average growth rate: 4,7% per year. • Distribution of the fleet by vehicle technology : • Flex fuel: 37% (2009), 78% (2019), • Gasoline (dedicated): 57% (2009), 21% (2019), • Ethanol (dedicated) : fleet almost disappear by 2019
Motorization Evolution • Brazilian motorization in the Reference Scenario(light vehicles per 1000 inhabitants) : 136 (2009), 192 (2019). • International comparisons: • Europe 27 countries (470 cars per 1000 inhabitants) (2008) • Japan (540 cars per 1000 inhabitants) (2008) • US (780 cars per 1000 inhabitants) (2007) • Note: according to the reference scenario, Brazilian motorization, in 2019, will be near that verified in Portugal, in 1990 (187 cars/1000 hab) . The current motorization index in Portugal is 415 cars/1000 hab. (EUROPEAN COMMISSION, 2010) • Uncertainty: how fast will motorization grow in developing countries, as Brazil, and which is the saturation level for this indicator? • Saturation of motorization: is not the same among countries. There are many factors that can influence this, as; the availability of public transport, demographic density, investments in transport infrastructure and local habits and culture. (Dargay ET AL, 2007).
Motorization Evolution Note: motorization in Brazil takes into account automobiles and light commercials. Source: EC, 2010; EIA/DOE, 2010; EPE, 2010. Comparison of Motorization (cars per thousand inhabitants) in selected countries and regions
Car fleet projections in Brazil– by fuel millions of vehicles gasoline ethanol flex fuel Source: EPE, 2010.
Penetration of ethanol • Main parameters to estimate the ethanol consumption by the flex fuel fleet: • Consumer preference • Ethanol price competitiveness versus gasoline in the retail market. • Ethanol is economically competitive with gasoline to the final consumer when : • peth / p gas < 0,7 due the lower efficiency performance of ethanol engine. • Considering the average price of the ethanol fuel in the Brazilians capitals between 2006 and 2010, fueling with ethanol was worthwhile to the consumer in most of the period.
Historic Evolution of price parity between gasoline and hydrated ethanol Figure 3: Historic Evolution of price parity between gasoline and hydrated ethanol
Emissions attributed to fuel consumption by automobiles in Brazil (2019) The growth of flex fuel cars fleet and the use of ethanol would reduce by 39% the total of CO2 emissions (case 1)
Conclusion (1) If the motorization of Brazil reaches the levels seen in OECD countries, the result in terms of energy consumption and CO2 emissions will be far more damaging on society. (2) To avoid this kind of trajectory, non OECD countries, such as Brazil, will have to become more concerned regarding other mobility policies Still a research in progress…
Conclusion Source: ANP, 2011. Note: At the beginning of 2011, the increase in sugar prices in international market and the dry weather reduced the supply of ethanol, resulting in higher cost of fuel to final consumers. Ethanol lose competitiveness in most state capitals, discouraging its use in flex-fuel vehicles and encouraging the consumption of gasoline. Figure 5: Hydrated Ethanol Parity Rates by Region in January 2011
Conclusion • This substitution observed in the short term resulted in the need to import gasoline to ensure supplies to the domestic market and stressed the need for regulation. • In this context, the government decided : • to strenghten ethanol giving new attribution to the National Agency of Petroleum, Natural Gas and Biofuels - ANP.
Thank you • natalia.moraes@epe.gov.br • helder@ie.ufrj.br
Fuel Consumption – Automobile in Brazil Source: National Energy Balance