Download
1 / 35
350 likes | 381 Vues
Delve into advanced X-ray techniques for spectroscopy at liquid surfaces, exploring polymer dynamics and interface behaviors. Learn about implications for NSLS-II and future prospects. Discover insights into molecular structure and wave dynamics in thin films.

E N D
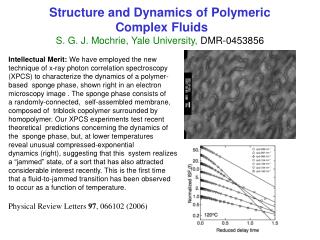
X-ray Photon Correlation Spectroscopy from Liquid Surfaces Laurence Lurio Department of Physics Northern Illinois University X-ray Photon Correlation Spectroscopy & Microbeam SAXS at NSLS-II Brookhaven National Laboratory January 8, 2008
Collaborators • Xuesong Xiao, Rakesh Vasudevan (NIU) • Zhang Jiang (PhD Thesis) , Mrinmay Mukhupadhyay, Sunny Sinha (UCSD) • Hyunjung Kim (Sogang U. Korea) • Jyotsana Lal, Xuesong Hu (IPNS) • Suresh Naryanan, Michael Sprung, Alec Sandy (8-ID ANL) • Simon Mochrie, Yale University • Miriam Rafaelovich, SUNY Stonybrook
Outline • Surface XPCS from a liquid polymer (PS) • Dynamics of a buried liquid-liquid interface (PS/PBrS) • Future prospects for surface XPCS • Implications for NSLS II
Example 1: Polystyrene Melts • A nice model liquid. Well characterized physical properties and slow dynamics. • Study how polymer dynamics is modified by confinement. • Study dynamics in a glass-forming thin film. Varnik et. al. EPJE, 2002
X-ray scattering as a Probe of Polymer Structure • Traditionally polymer structural measurements are done using neutron scattering. Deuteration provides a contrast mechanism. • X-ray scattering measures correlations in electron density, thus to see structure need a contrast mechanism, e.g. a density variation • Melt/vapor interface gives a strong contrast between vacuum and polymer. Also can get contrast at a liquid/liquid or liquid solid interface.
Structure at the Liquid-Vapor Interface is dominated by thermally driven capillary waves Linearized Navier-Stokes Equation Note that for films whose thickness is comparable to the capillary wavelength, the dynamics of the capillary wave probe motion throughout the entire film.
Thermal Capillary Wave Roughness • Each mode carries energy • X-ray scattering intensity is approximately given by For small q
What you learn by scattering x-rays from capillary waves • Amplitude of scattering measures surface tension. • Relaxation rate of capillary waves probes viscoscity. • Wavevector dependence of relaxation rate probes hydrodynamics within film. • Wavevector dependent cut-offs measure Van der Waals forces and shear modulus.
Scattering of Coherent X-rays For incoherent x-rays the actual scattering represents a statistical average over many incoherent regions within the sample and one obtains: For coherent x-rays one measures the Fourier transform of the exact density distribution, not the average. What one observes is a speckle pattern superposed on the average scattering pattern.
Single Layer Dynamics • Time required for a surface mode of wavevector q=2p/l to relax. • Use linear response theory to calculate the susceptibility of surface height fluctuations. For viscous fluid find overdamped modes which decay exponentially. • Time correlation of the x-ray scattering pattern yields the decay times
Single Layer Time Constants J. Jäckle, J. Phys.: Condens. Matter 10 (1998) 7121. For scaling arguments for thin films see Brochard and de Gennes, Capillarity and Wetting
1 . 1 0 q = 3 . 8 5 E - 4 | | = 1 2 4 . 0 s e c t 1 . 0 5 1 . 0 0 0 . 1 1 . 0 1 0 . 0 1 0 0 . 0 1 . 1 0 q = 5 . 8 7 E - 4 | | = 3 6 . 1 s e c t 1 . 0 5 2 g 1 . 0 0 0 . 1 1 . 0 1 0 . 0 1 0 0 . 0 1 . 1 0 q = 8 . 9 2 E - 4 | | = 7 . 8 s e c t 1 . 0 5 1 . 0 0 0 . 1 1 . 0 1 0 . 0 1 0 0 . 0 1 . 1 0 q = 1 . 2 3 E - 3 | | t = 1 . 5 s e c 1 . 0 5 1 . 0 0 0 . 1 1 . 0 1 0 . 0 1 0 0 . 0 t i m e d e l a y ( s e c ) Dynamics for PS films supported on Silicon(Thick films, T>>Tg) Hyunjung Kim et. al. PRL 2003 84 nm (circ.), 177 nm (triang.), and 333 nm (diam.).
What about x-ray damage • Samples begin to damage after around 1000s. • In poor vacuum samples last ~100s, probably due to ozone. • Several ways to probe for damage: • comparing correlation functions. • measurement of specular reflectivity before and after exposure. • examination of sample under an optical microscope. • Damage threshold ~108 Gy (vs. 107 Gy for protein crystallography (Tang & Moffat JSR 2000)
Why is the contrast so small? • Longitudinal Coherence Length • Coherence requires • In transmission • Coherence requires L
Close to Tg • Relaxation becomes a stretched exponential. • Viscosity much smaller than bulk q=.018 nm-1 , 129K 160 nm (thick film limit) T = 110C
Results for films with h~RgJiang et. al. PRL 2007 • Films thinner than ~2 Rg, q dependence changes. • Fitting requires the addition of a shear modulus • Films with ~1Rg appear to be static
Example 2: Dynamics from a Buried Interface • PS/PBrS bilayer • Independently measure dynamics at interface and surface. • Use x-ray standing wave for depth resolution.
Interest in Polymer bilayers • Technologically important system • Co-extrusion of polymers • Mechanical toughness • Optical multilayers • Physics of the polymer interface • Physical parameters: viscosity, interfacial tension. • Intermixing, Entanglement, Slip • De-wetting Mechanisms • Tg depression
Select an interface using an x-ray standing wave excited through a grazing incidence beam(0.14◦ and 0.18 ◦)
Autocorrelation functions-205oc Single layer PS Bilayer interface surface
Wavevector Dependence of Dynamics 195C 100 nm PS/200 nm PBrS Slow mode of top interface Single mode of bottom interface stick slip Mode of single layer PS Fast mode of top interface
Results of Bilayer Measurements • A PS film on-top of a PBrS layer shows faster dynamics than the same thickness PS film on a Si substrate • Time independent dynamics consistent with the Maxwell relaxation time determined by a sheer modulus for a thin interfacial layer. Value is (within uncertainty) identical to that found for thin PS homopolymer films. • Experiment inspired theory: Zhang et. al. PRE, 2006 (Separate interface region) , Henle & Levine PRE, 2007 (Slip length model, with only two layers) • Results for separate interface model
Future Prospects for Surface XPCS • Can the dynamics of biological systems in aqueous media be measured with XPCS? • Start with something simpler: Dynamics of biomimetic membranes: e.g. phospholipid bilayers supported with a soft cushion on a substrate • XPCS measures dynamics normal to the surface as opposed to Fluorescence techniques which measure in-plane dynamics. From Tanaka, MRS Bull. 2006
Are the technical problems solvable? • Dynamics in the microsecond to millisecond range: need enough coherent flux to get usable SNR. • Easily flux damaged samples: don’t want too much flux.
Beam Damage • If present systems are close to the damage threshold, does this mean it will be impossible to measure faster systems? • Figure of merit: • If you have as much coherent flux as you need and you are willing to translate the sample out of the beam once per correlation time then the beam damage is given by • Thus for a fixed SNR, with a translated sample • Measuring fast dynamics will give less rather than more beam damage
Is it doable? • Measurements (so far unsuccessful) of XPCS from protein suspensions indicate a damage threshold ~100-1000 times lower than for polymers films. It is not clear where phospholipids would damage, but assume worst case. • If dynamics are ~ 1 ms and if contrast can be brought up to 100% and if the detector efficiency can be brought to 100% than this implies a reduction in damage by
Can you can do even better? • Blowing up the beam size reduces the SNR as the square root of the beam area. Damage is reduced as the area. • Increasing the beam energy reduces the beam damage as E3 but only decreases the SNR as E-2. • Note that both of these methods decrease the SNR however they decrease the damage even faster. They are only feasible with lots of coherent flux to waste.
Implications for NSLS II • Surface XPCS experiments may require narrow energy resolution. • Design beamlines for close to 100% coherence, even at some cost in SNR. • Scatter at higher energies (15 keV) but only if there is enough flux to offset the cost in SNR • Provide mechanisms to translate samples through the beam. • Provide focusing options to increase or decrease beam size.
Detectors must be improved • Fast readout • High efficiency • Low noise • High spatial resolution • Selective ROI readout
Thanks to: • National Science foundation grants DMR-020954 and DMR-0706369