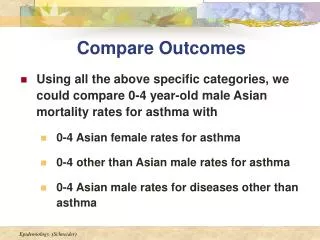
Compare Outcomes
Compare Outcomes. Using all the above specific categories, we could compare 0-4 year-old male Asian mortality rates for asthma with 0-4 Asian female rates for asthma 0-4 other than Asian male rates for asthma 0-4 Asian male rates for diseases other than asthma. Calculation Practice.

Compare Outcomes
E N D
Presentation Transcript
Compare Outcomes • Using all the above specific categories, we could compare 0-4 year-old male Asian mortality rates for asthma with • 0-4 Asian female rates for asthma • 0-4 other than Asian male rates for asthma • 0-4 Asian male rates for diseases other than asthma
Calculation Practice Calculate cause-specific and age-specific lung cancer death rates What information will you need?
Lung Cancer Deaths by Age Group, United States, 1995 Lung Cancer Deaths Age (years) Population 5-14 38,134,488 11 15-24 35,946,635 41 25-34 40,873,139 303 35-44 42,467,719 2,709 45-54 31,078,760 12,356 Total 188,500,741 15,420 How would you calculate the cause-specific lung cancer death rate? How would you calculate age-specific lung cancer death rates?
Lung Cancer Deaths by Age Group, United States, 1995 Age (years) Population Lung Cancer Deaths Age-Specific Lung Cancer Death Rate 5-14 38,134,488 11 11 / 38,134,488 = 0.03 15-24 35,946,635 41 41 / 35,946,635 = 0.11 25-34 40,873,139 303 303 / 40,873,139 = 0.74 35-44 42,467,719 2,709 2,709 / 42,467,719 = 6.38 45-54 31,078,760 12,356 12,356 / 31,078,760 = 39.76 xxx Total 188,500,741 15,420 Cause Specific Rate = (15,420/188,500,741) x 100,000 = 8.18 / 100,000 What inferences can you make from these age-specific rates?
Mortality Outcomes (cont.) • Adjusted rate: • Used to compare rates for entire populations, taking into account differences in variables we consider as influencing outcomes (age, gender, race)
Two methods to adjust rates: • Direct Method: AAR (age-adjusted rate) • Indirect Method: SMR (standardized mortality ratio)
Standardization for Age (Age Adjustment) • Direct method • Requires • Age-specific rates for the sample • Age-structure of a standard population • Yields a summary figure: AGE-ADJUSTED RATE
Standardization: Age Adjustment (cont.) • Indirect method • Requires • Age structure of the sample population at risk • Total cases in the sample population (not ages of cases) • Age-specific rates for a standard population • Yields a summary figure: STANDARDIZED MORTALITY RATIO (SMR)
Creating a cause-specific, age-adjusted death rate using direct standardization Age Cancer Deaths Age Specific Rate (per 1000) Expected Population at risk 1980 U.S. Standard Population (1) (2) (4) (3) x (4) = (5) (1) / (2) = (3) 0-18 5 5,000 60,500,000 19-64 10 25,000 140,300,000 65+ 100 15,000 25,700,000 226,500,000 Total 115 45,000 xxx
Creating a cause-specific, age-adjusted death rate using direct standardization 1980 U.S. Standard Population Age Cancer Deaths Population at risk ASR / 1000 Expected (1) (2) (1) / (2) = (3) (4) (3) x (4) = (5) 0-18 5 5,000 1.00 60,500,000 60,500,000 19-64 10 25,000 0.40 140,300,000 56,120,000 65+ 100 15,000 6.67 25,700,000 171,419,000 Total 115 45,000 xxx 226,500,000 288,039,000 Crude Rate (115 / 45,000) x 1000 2.56 per 1,000 > Age-Adjusted Rate (288,039,000 / 226,500,000) x 1000 1.27 per 1,000
Comparing crude and age-adjusted rates • If crude rate decreases after adjustment, the study population is older than the standard population (Crude rate > age-adjusted rate study population is older) • If crude rate increases after adjustment, the study population is younger than the standard population (Crude rate < age-adjusted rate study population is younger)
The adjusted rate tells you what the rate would be if the sample population had a similar age structure to that of the United States in 1980
Comparing Crude and Age-Adjusted Rates (cont.) • San Francisco males and females had crude rates double those for their counterparts in San Jose • San Francisco may have had an older population than San Jose and therefore higher crude rates • NEVERassume from crude rates that one place is less healthy than another
Comparing Crude and Age-Adjusted Rates (cont.) • When age structure was controlled through age-adjustment, San Francisco no longer stood out as having higher rates • San Jose’s age-adjusted rates were slightly higher than those for San Francisco • Public health as measured by age-adjusted rates is not significantly different between the two cities • Note: Failure to take differences in population structures into account may lead to inappropriate conclusions • Adjustment aids in preventing CONFOUNDING
Comparing Crude and Age-Adjusted Rates (cont.) • One type of rate is not necessarily more important than another • Which you choose depends on the information sought • To estimate the economic burden of high rates on a community, it is usual to start with cruderates • Crude rates are often used for health services planning
Comparing Crude and Age-Adjusted Rates (cont.) • To compare rates among subpopulations or for various causes, specificrates are preferred • infant mortality • maternal mortality rates • To compare the health of entire populations, adjusted rates are preferred as they allow for comparison of populations with different demographic structures
New 2000 Standard for Age-Adjustment • Historically, a 1940 base-year has been used for age-adjustment • Also, other standards have been used which created confusion among data users • Starting September 1, 1998, HHS agencies and programs were required to use the year 2000 standard
New 2000 Standard for Age-Adjustment (cont.) • What are the implications? • When describing disparities in mortality between racial and ethnic groups, the size of the disparity between Blacks and Whites and between Hispanics and Non-Hispanics will be affected
New 2000 Standard for Age-Adjustment (cont.) • Example: The mortality ratio for Black and White total populations in 1995 is reduced from 1.6 (1940 standard) to 1.4 (2000 standard) • The Blacks population tends to be younger than the White population
New 2000 Standard for Age-Adjustment (cont.) • NCHS recommends that researchers present age-specific rates, not just AARs • If an AAR is used to describe racial and ethnic disparities, explain the impact of the change in the standard and provide age-specific rates • When comparing AARs over time, make sure the same standard is used throughout
Alternate Method of Direct Adjustment • Some calculators cannot handle large numbers • To overcome this limitation, you can convert your standard population into a standard vector
Age Population Vector (%) 0-4 16,348,254 0.072 Calculate a STANDARD VECTOR (1980 US Census) 5-14 34,942,085 0.154 15-24 42,486,828 0.188 25-34 37,081,839 0.164 35-44 25,634,710 0.113 45-54 22,799,787 0.101 55-64 21,702,875 0.096 65-74 15,580,605 0.069 75-84 7,728,755 0.034 85+ 2,240,067 0.010 Total 226,545,805 1.000
Age Deaths ASR per 1000 Expected Population at Risk Std Vector (%) Create a STANDARDIZATION TABLE and calculate rates 0-4 160 5,674 28.199 0.072 2.030 5-14 30 22,167 1.353 0.154 0.208 15-24 30 51,932 0.578 0.188 0.109 25-34 26 32,565 0.798 0.164 0.131 47 1.387 35-44 33,877 0.113 0.157 124 41,633 2.978 0.101 0.301 45-54 320 41,670 7.679 0.096 0.737 55-64 65-74 829 51,985 15.947 0.069 1.100 75-84 1,901 65,783 28.898 0.034 0.983 85+ 2,259 27,379 82.508 0.010 0.825 Total 5,726 374,665 XXXXX 1.000 6.581 Crude Rate = 15.283per 1000Age-Adjusted Rate = 6.58 per 1000
Sometimes there are COHORT EFFECTS that need to be considered as specific groups may vary in exposures or treatments as they move together through time.