Compare …
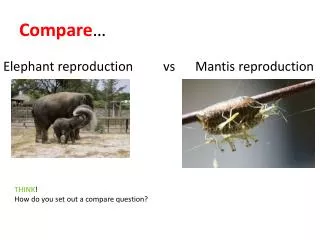
Compare …. Elephant reproduction vs Mantis reproduction. THINK ! How do you set out a compare question?. Population growth. Reproductive Strategies. Learning outcomes. Describe the principles associated with survivorship curves including, K-strategists and r-strategists.

Compare …
E N D
Presentation Transcript
Compare… Elephant reproduction vs Mantis reproduction THINK! How do you set out a compare question?
Population growth Reproductive Strategies
Learning outcomes Describe the principles associated with survivorship curves including, K-strategists and r-strategists. You should all be able to: • Identify the characteristics of K- and r-strategists Most of you should be able to: • Describe the association between these characteristics and survivorship curves Some of you might be able to: • Interpret the more complex features of survivorship curves - including logarithmic scales.
Different reproductive strategies!! K-strategists Slow growing organisms, limited by the carrying capacity (K) of an environment. r-strategists Characterised by rapid growth followed by decline – tend to inhabit unpredictable rapidly changing environments. Have a fast rate (r) of increase.
Survivorship curves Look at the graph on your handout!… Group discussion: What is shown on the x- and y- axes? What is unusual about the y-axis?
Discuss in pairs…. Now annotateyour graphs with what we have discussed! Almost all individuals survive for their potential lifespan and then die almost simultaneously (K-strategists) Look at the 3 survivorship curves… Which curve do you think represents a K-strategist and which an r-strategist? Individuals that lie between the two extremes (C-strategists). This curve is rather rare. It represents species that have an equal chance of dying at any age. Most individuals die at a very young age but those that survive are likely to live for a very long time (r-strategists)
Test yourself • Explain whether K- or r-strategists would be more likely to be regulated by density-independent limiting factors e.g. the weather. • Describe and explain the shape of the survivorship curve for K-selected species.