Download
1 / 158
1.6k likes | 1.78k Vues
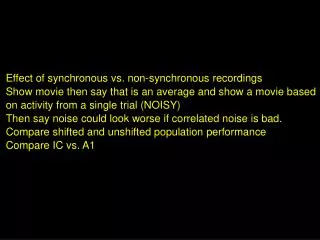
Effect of synchronous vs. non-synchronous recordings Show movie then say that is an average and show a movie based on activity from a single trial (NOISY) Then say noise could look worse if correlated noise is bad. Compare shifted and unshifted population performance Compare IC vs. A1.

E N D
Effect of synchronous vs. non-synchronous recordings Show movie then say that is an average and show a movie based on activity from a single trial (NOISY) Then say noise could look worse if correlated noise is bad. Compare shifted and unshifted population performance Compare IC vs. A1
Effect of Neural Correlations on Speech Discrimination Mike Kilgard Associate Professor University of Texas at Dallas Cosyne08 Workshop: Real-Time Processing and the Processing of Time
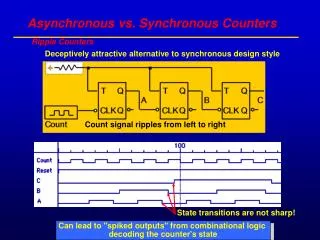
Pad Bad Fad Vad Mad Wad Tad Dad Sad Zad Chad Jad Nad Lad Kad Gad Shad Had Yad Rad 30 kHz 20 10 0 200 400 600 ms
Pad Bad Fad Vad Mad Wad Tad Dad Sad Zad Chad Jad Nad Lad Kad Gad Shad Had Yad Rad 30 kHz 20 10 0 200 400 600 ms
Rats can discriminate most human speech sounds. Data from 5 or 6 rats after ten days of training on a Go/No Go task.
Observation: Rats can discriminate most speech sounds. Question: How are these sounds represented in the central auditory system?
Neurograms of 445 multi-unit recordings from anesthetized A1, 20 repeats
Neurograms of 445 multi-unit recordings from anesthetized A1, 20 repeats
Movie of A1 responses from one rat N = 63 A1 multi-unit recording sites, average of 20 repeats
Observation: Most speech sounds evoke unique spatiotemporal activity patterns in A1. Question: What is the relationship between neural responses and speech discrimination ability?
Euclidean distance between neurograms is well correlated with behavior only when 1 ms bins are used. N=445 A1 multi-unit recording sites
Observation: Sounds that evoke dissimilar spatiotemporal activity patterns are readily discriminable. Question: Can A1 neurons discriminate speech sounds in a single trial?
Single Trial N = 63 A1 multi-unit recording sites
95% correct 100% correct 80% correct 75% correct Average PSTH’s Dad Bad PSTH-based Classifier (Foffani & Moxon, 2004; Schnupp et al., 2006) Single trials matched to mean PSTH templates using Euclidean distance. Triangles indicate classification errors. Dad Single Trial PSTH’s Bad
Classifier Performance using Spike Timing 95% correct 100% correct 80% correct 75% correct Average PSTH’s Dad Bad Dad Single Trial PSTH’s Bad Mean of 445 sites was 90±3% when 1-10 ms bins were used.
Classifier Performance using Spike Number 68% correct 63% correct 60% correct 63% correct Average PSTH’s Dad Bad Dad Single Trial PSTH’s Bad Mean of 445 sites was 90±3% when 1-10 ms bins were used.
Neural discrimination using one sweep of activity from individual multi-unit clusters recorded in A1 N=445 A1 multi-unit recording sites
Observation: A single trial of onset activity from A1 neurons recorded at a single site can discriminate speech sounds as well as rats. Question: Is this true in awake rats?
Awake Auditory Cortex N = 41 A1 multi-unit recording sites
Observation: A single trial of onset activity from awake A1 neurons recorded at a single site can discriminate speech sounds as well as rats. Question: How good is speech discrimination if more or fewer A1 sites are used?
Neural Discrimination of English Consonants d/s d/b d/g d/t sh/f sh/j sh/h sh/ch sh/s r/l m/n Percent Correct
Observation: A single trial of activity from several hundred A1 neurons can discriminate between pairs of English consonants with 100% accuracy. Question: Can A1 activity distinguish speech sounds from a larger set?
Neural Discrimination of 20 English Consonants Percent Correct
Observation: A single trial of activity from a set of ~400 A1 neurons can discriminate between 20 English consonants with 100% accuracy. Question: Is this an artifact of serial recordings?
95 % correct 100% correct 80% correct 75% correct Average PSTH’s Dad Bad Dad Single Trial PSTH’s Bad Mean of 445 sites was 90±3% when 1-10 ms bins were used.
95 % correct Average PSTH’s Dad Bad Dad Single Trial PSTH’s Bad
Observation: A single trial of activity from a set of four simultaneously recorded A1 multi-unit clusters can discriminate between 20 English consonants almost as well as serially recorded sites. Question: Is this true in awake rats?
Observation: A single trial of activity from a set of four simultaneously recorded A1 multi-unit clusters can discriminate between 20 English consonants almost as well as serially recorded sites. Possible Explanation: The readout mechanisms are optimized for categorization, not identification.
Pad Bad Fad Vad Mad Wad Tad Dad Sad Zad Chad Jad Nad Lad Kad Gad Shad Had Yad Rad 30 kHz 20 10 0 200 400 600 ms
Image reconstructions using only temporal order of the first spike of Retinal Ganglion Cell populations .05% .5% 1% 5% 50% Van Rullen & Thorpe, 2001
Speech Conclusions Rats are able to accurately discriminate most speech sounds. Consonants appear to be represented by onset firing patterns. A single sweep of activity is sufficient to discriminate most sounds. Responses in A1 are highly correlated with behavioral discrimination. Tomorrow at ‘Linking Auditory Neurophysiology to Perception’ Speech in Noise Non-Primary Auditory Cortex and Inferior Colliculus Vowel coding Categorization Plasticity
National Institute for Deafness and Other Communicative Disorders Acknowledgements: Crystal Engineer - Speech Training and A1 physiology Claudia Perez - Speech Training and Inferior Colliculus Jai Shetake - Awake A1 Speech Physiology
a) b) One Single Unit Sixteen Single Units One Multi- Unit Sixteen Multi- Units One Single Unit Sixteen Single Units One Multi- Unit Sixteen Multi- Units Figure 7
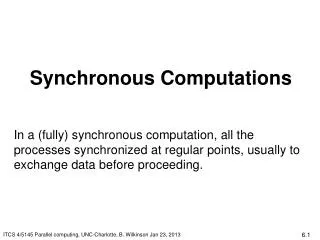
Neural Activity Patterns Predict Speech Discrimination Ability in Rats Mike Kilgard University of Texas at Dallas
What is the relationship between neural responses and speech discrimination ability?
Sad Mean IC PSTH N=187 sites, 6 rats 40 Frequency (kHz) Firing Rate (Hz) 30 20 10 0 100 200 300 400 500 600 0 100 200 300 400 500 600 Time (msec) Time (msec)
Sad Mean IC PSTH’s N=187 sites, 6 rats High 40 Frequency (kHz) 30 Medium 20 Low 10 0 100 200 300 400 500 600 0 100 200 300 400 500 600 Time (msec) Time (msec)
Inferior Colliculus Neurograms N=187 sites, 6 rats
A1 Neurograms N=441 sites, 11 rats Spatial Temporal
A1 Neurograms N=441 sites, 11 rats
Sad vs. Dad High Medium Low Time (milliseconds)
Speech Discrimination by Rats Dad or Sad Easy!
Rad vs. Lad High Impossible Medium Low Time (milliseconds)
Bad vs. Dad High Impossible using mean rate or Easy using spike timing? Medium Low
Rat Consonant Discrimination N=11 rats
Onset Neurograms N=441 A1 sites, 6 rats