Understanding Measurement Scales in Research: Nominal, Ordinal, Interval, and Ratio
This review provides a comprehensive analysis of the four fundamental scales of measurement: nominal, ordinal, interval, and ratio. It explains their characteristics, including their categorical or quantitative properties, and how they relate to data analysis in research investigations. The discussion extends to methods for analyzing research results, including comparing group percentages, correlating scores, and comparing means. It also covers descriptive statistics, focusing on central tendency measures (mean, median, mode) and variability (standard deviation, range, variance), helping to clarify how data can be represented and interpreted effectively.

Understanding Measurement Scales in Research: Nominal, Ordinal, Interval, and Ratio
E N D
Presentation Transcript
SCALES OF MEASUREMENT: A REVIEW • Nominal • No numerical, quantitative properties • Levels represent different categories or groups • Ordinal – minimal quantitative distinctions • Order the levels from lowest to highest • Interval – quantitative properties • Intervals between levels are equal in size • Can be summarized using means • No absolute zero • Ratio – detailed quantitative properties • Equal intervals • Absolute zero • Can be summarized using mean
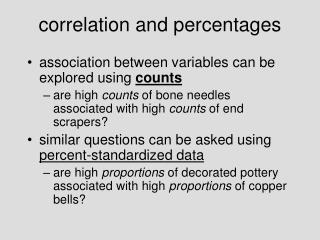
ANALYZING THE RESULTS OF RESEARCH INVESTIGATIONS • Three basic ways of describing the results: 1. Comparing Group Percentage 2. Correlating Individual Scores 3. Comparing Group Means
ANALYZING THE RESULTS OF RESEARCH INVESTIGATIONS • Comparing Group Means Treatment group Waitlist group 4 7 3 8 6 5 2 6 5 9 . S= 20 S= 35 M= 4 M= 7
FREQUENCY DISTRIBUTIONS • Graphing Frequency Distributions • Pie charts • Bar graphs • Frequency polygons • Histograms
Histogram 5 4 Model group Frequency 3 2 1 3 4 5 6 7 Scores on Aggressive Measure
DESCRIPTIVE STATISTICS • Central Tendency • Mean (X) • Found by adding all the scores and dividing by the number of scores • Indicates central tendency with interval or ratio scales • Median (Mdn) • Score that divides the group in half (with 50% scoring below and 50% scoring above the median) • Indicates central tendency with ordinal, interval, and ratio scales • Mode • Most frequent score • Indicates central tendency with all scales including nominal scales
DESCRIPTIVE STATISTICS • Variability – the amount of spread in the distribution of scores • Standard deviation = (s) (SD) in reports • Square root of the variance • Range • Difference between highest and lowest score • Variance (s²)