Download

1 / 21
210 likes | 360 Vues
SharePoint 2011 as a Business Intelligence Platform for On-Premise and Cloud Data. Adis Jugo, Managing Consultant , PlanB. GmbH. Agenda. History of BI in SharePoint What is new with SharePoint 2010 How to do BI with SharePoint. History of BI with SharePoint. Where it used to be:

E N D
SharePoint 2011 as a Business Intelligence Platform for On-Premise and Cloud Data Adis Jugo, Managing Consultant, PlanB. GmbH
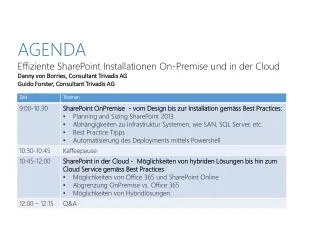
Agenda • History of BI in SharePoint • What is new with SharePoint 2010 • How to do BI with SharePoint
History of BI with SharePoint • Where it used to be: • Display Reporting Services Reports in web parts • Reporting Services in SharePoint-integrated mode • Simple KPI lists (now called status lists) • Excel Services: dynamic Excel Reports in a web browser
What is new with BI in SharePoint 2010 • Now also directly integrated: • New site template “Business Intelligence Center” • PerformancePoint Services (PPS) 2010 is the next generation corporate performance-management application from Microsoft • Now a SharePoint 2010 service application • End-users can create KPIs and scorecards themselves • Interactive reports and analysis in the web
Who does what? • IT • PPS: Install and configure • PPS: Create and manage data sources • Power-users and developers • Create Excel Tables and PowerPivots • Create reports • Configure PPS elements / Publish dashboards • End-Users • Browse Excel Services and published PPS-dashboards in SharePoint and interact with them
Excel Services • Excel is THE most used BI tool in the world • Dozens of Excel Workbooks are circulating around the companies • Publish whole or a part of the Excel Sheet to the SharePoint – reuse your knowledge • Communicate with Excel Services (API)
PerformancePoint Services • Now part of the SharePoint Server 2010 (Enterprise Edition) • Connect to the different sources of data • Dashboard Designer
PerformancePoint Services • New site type: BI Center
UseCase • We are organizing a conference • Data Structure in the SQL Server: Speakers, Sessions, Visitors, Ratings • Dashboard Designer:
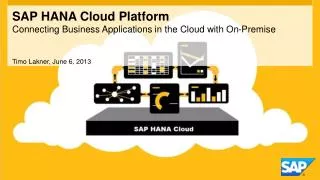
UseCase • We are organizing a conference • Data Structure in the Azure SQL Server: Speakers, Sessions, Visitors, Ratings • Data Synchronized to the SharePoint through BCS • Dashboard Designer: connect to the local data
Beyond BI Center • Custom development • Silverlight • ECMA Script • UseCase:Visualize visitors through the BING MAPS
Create Silverlight WebPart to visualize the visitors origin through the BING Maps
Conclusion • Possibilities for business users are enormous • …if they have the SharePoint Enterprise CAL • Self Service in SharePoint, now available for Performance Management • See PowerPivot for Excel 2010 • By all means a useful reporting portal!
Questions? • Thank you! • @adisjugo • http://adis.jugo.ba • http://www.1sug.com • http://plan-b-gmbh.com