Make a Graph
Make a Graph. Example. Jeannie’s candle was originally 20 cm long, but it measured 18 cm after burning for 30 min. and 16 cm after burning for 1 hr. How long would it take for the candle to burn completely? If she lit the candle at 6:00 PM and blew it out at 8:20 PM, how long is the candle?.


Make a Graph
E N D
Presentation Transcript
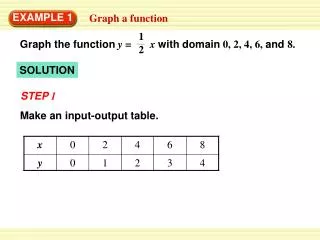
Example Jeannie’s candle was originally 20 cm long, but it measured 18 cm after burning for 30 min. and 16 cm after burning for 1 hr. How long would it take for the candle to burn completely? If she lit the candle at 6:00 PM and blew it out at 8:20 PM, how long is the candle?
Think: Determine what you are trying to find. You want to know how long the candle will burn and how long it will be at 8:20 PM.
Think: How can the data in the problem be organized? Make a set of ordered pairs in which the first number represents the burning time in minutes (t) and the second number represents the length of the candle in centimeters (l).
Think: How can the data in the problem be organized? l t 20 0 18 30 16 60
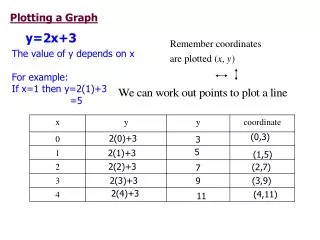
Think: Can these ordered pairs be graphed to help you see the relationship more clearly? Construct a graph in which the horizontal axis represents time, t, and the vertical axis represents the length of the candle, l. Plot the three ordered pairs from the table on the graph.
Length of Candle (in centimeters) Burn Time (in hours)
Think: Do these points form a particular shape? Do you think this shape will remain constant throughout the problem? The ordered pairs form a line. This shape will remain constant as long as the candle burns at a constant rate.
Length of Candle (in centimeters) Burn Time (in hours)
Think: How could you find out what the length of the candle will be over an extended period of time? Connect the points and extend the line until it reaches the horizontal axis.
Length of Candle (in centimeters) Burn Time (in hours)
Think: From the graph, how can you tell the total burning time of the candle? The candle has completely burned when the line reaches the horizontal axis (the candle has no length). Find the value of t at this point on the graph; the total burning time of the candle is 5 hr.
Length of Candle (in centimeters) Burn Time (in hours)
Think: If Jeannie blows the candle out at 8:20 PM, how can you tell how much candle remains? Locate the elapsed time on the horizontal axis of the graph, move up to the point on the line, and then move left to the vertical axis. The candle is about 11 cm long at 8:20 PM.
Length of Candle (in centimeters) Burn Time (in hours)
Think: Was the graph helpful in solving the problem? Do you think there are any more efficient ways to solve it? The graph was helpful, giving a useful estimate. A more precise graph, an extended table, or an algebraic equation could have also been used.
Example James rents movies at a video rental store. If he pays $3.50 per movie and rents about seven per month, would it be more economical for him to buy a membership for $20 per month with unlimited rentals?
Example The cost of a new car steadily increases over a period of five years. In 2010 the average price of a new midsize car was $20,500. If each year the average price increased by 5%, how much would it be in 2015?
Exercise It is found that for every five homework problems you do before an exam, your math grade will go up 1%. Assuming this is true and that your grade is currently 82%, graph this relationship.
Use the point (0, 80) for the origin, and mark off the x-axis in units of five problems worked and the y-axis in units of 1%. From the given information, plot two points and draw a line graph.
Use the graph to determine how many problems you should do before the next exam to get a 90%. What percentage would you predict if you worked fifty homework problems before the final exam?
Exercise A manufacturer estimates that he spends $2.50 for labor per model airplane plus the fixed costs of $900 per week to keep his plant open. The plant normally produces 3,000 models per week.
Find the cost to produce the normal output of 3,000 model airplanes per week.
Assume the manufacturer keeps the plant open but produces no models. Use this point and the one determined by your calculation in the last problem to graph a line. Use the point (0,0) for the origin, increments of 500 models for the x-axis, and increments of $3,000 for the y-axis.
From the graph, find the cost of producing (a) only 2,000 planes in a week and (b) only 1,000 planes in a week.
Assume that the model planes net $9 each after the expenses of selling them are paid. Use this information and the costs calculated in the previous exercises to calculate the profit from producing and selling (a) 3,000 planes, (b) 2,000 planes, and (c) 1,000 planes.
Exercise The E-Z Fit center charges an initial fee of $50 and a monthly fee of $30. The Basic Fitness club has a monthly fee of $40 with no initial membership fee.
On the same set of axes, produce a line graph of the cost for membership in each fitness club. Label the x-axis as length of membership in months, using one-month increments. Label the y-axis as cumulative cost, using $40 increments.
If you stay a member for three months, which fitness center would be more economical to join? How much cheaper is it?
If you use the fitness center for a year, which one would be more economical? How much would you save over the year by joining the center that is more economical?
At what point will the total cost of the fees for the two fitness centers be the same?