Multi-Wavelength Time Variability of Active Galactic Nuclei
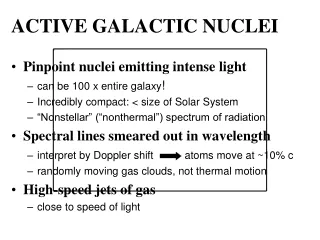
360 likes | 454 Vues
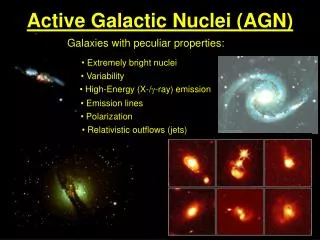
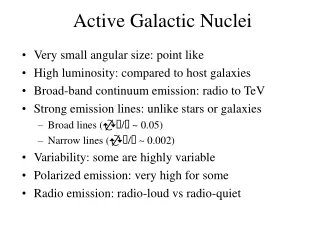
Explore time variability in AGNs, focusing on 3C 279 & 3C 120. Discuss X-ray/optical correlation, emission mechanisms, and downstream SSC effects. Conclusions on emission location and mechanism.

Multi-Wavelength Time Variability of Active Galactic Nuclei
E N D
Presentation Transcript
Multi-Wavelength Time Variability of Active Galactic Nuclei Ritaban Chatterjee Advisor: Prof. Alan P. Marscher Collaborators: Svetlana Jorstad (B.U.), Phil Uttley (U. Southampton, UK).
3C 279 3C 279 Z=0.536 1 mas = 6.3 pc
Monitoring of 3C 279 between 1996-2007 X-RAY OPTICAL RADIO
3C 279 : X-ray-optical Cross-Correlation Optical leads X-ray by ~ 19 Days Chatterjee et al. 2008 (ApJ, 489, 79)
X-ray and Optical : Superposed • Compare: • 1. Time lag • between peaks • Energy output of flares : • Area under the curve
Larger time delay, Ratio<1 Smaller time delay, Ratio ~1
Optical => Synchrotron • X-ray=> Synchrotron self-Compton (SSC) • Simulation of time variable non-thermal radiation Modeling of synchrotron (optical) and synchrotron self-Compton (X-ray) flares B ~r-b, N0 ~r-n, R ~r
Real and Simulated Light Curves Chatterjee et al. (submitted to ApJ)
Real and Simulated Light Curves SIMULATED REAL Chatterjee et al. (submitted to ApJ)
Downstream SSC (Green) maybe smaller than Synchrotron (Red) UPSTREAM DOWNSTREAM
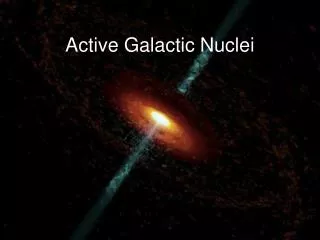
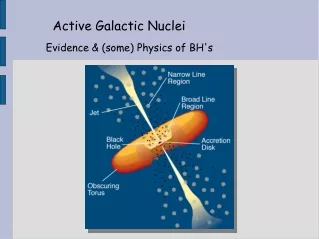
Sketch of emission regions at two different locations in the jet Upstream Downstream x/op<1 x/op~1
Sketch of emission regions at two different locations in the jet Upstream Downstream ∆t larger x/op<1 ∆t smaller x/op~1
Larger time delay, Smaller ratio Smaller time delay, Ratio ~1
CONCLUSIONS: LOCATION AND MECHANISM OF EMISSION • X-ray and optical variations are highly correlated. • X-ray/optical correlation changes over time. • Contemporaneous X-ray and optical flares: X/OP ≈ 1 => closer to the base of the jet X/OP << 1 => farther from the base of the jet
Light Curves of 3C 120 between 2002 and 2007 X-RAY OPTICAL RADIO
Variability at different timescales
3C 120 X-Ray Power Spectral Density (PSD) Break Frequency =10-5 Hz Break Time Scale =2 Days
X-Ray PSD of Cygnus X-1 : Break BH Mass vs. Break Time Scale Credit : Uttley et al. (2004)
X-Ray PSD of Cygnus X-1 : Break BH Mass vs. Break Time Scale 3C 120 Credit : Uttley et al. (2004)
Light Curves of 3C 120 between 2002 and 2007 X-RAY OPTICAL RADIO
X-ray/37 GHz Anti-correlation (X-ray leads 37GHz by 120 days) Chatterjee et al. 2009 (in prep)
Possible Explanation of theX-ray Dip and Superluminal Ejection Correlation 1. Change in the magnetic field configuration in the accretion disk from turbulent to aligned => absence of viscous heating causes dips in X-ray production => aligned B field configuration facilitates shock to move towards the jet (Livio et al. 2003) 2. Corona is the base of the jet => decrease in the number density of electrons at the base of the jet => causes X-ray dips and increase in the speed of particles (continuity eqn.) => causes shock wave.
X-ray light curve : Sum of model flares & real data Chatterjee et al. 2008 (ApJ, 689, 79)
Optical light curve : Sum of model flares & real data Chatterjee et al. 2008 (ApJ, 689, 79)
3C 120 X-Ray Power Spectral Density (PSD) Break Frequency =10-5 Hz Break Time Scale =2 Days