Download
1 / 28
280 likes | 303 Vues
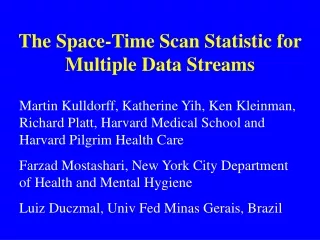
The Space-Time Scan Statistic for Multiple Data Streams. Martin Kulldorff, Katherine Yih, Ken Kleinman, Richard Platt, Harvard Medical School and Harvard Pilgrim Health Care Farzad Mostashari, New York City Department of Health and Mental Hygiene Luiz Duczmal, Univ Fed Minas Gerais, Brazil.

E N D
The Space-Time Scan Statistic for Multiple Data Streams Martin Kulldorff, Katherine Yih, Ken Kleinman, Richard Platt, Harvard Medical School and Harvard Pilgrim Health Care Farzad Mostashari, New York City Department of Health and Mental Hygiene Luiz Duczmal, Univ Fed Minas Gerais, Brazil
Different Data Sources For example: • OTC Drug Sales, from pharmacy chains • Nurses Hotline Calls, from Optum • Regular Physician Visits, from HMOs/VA • Emergency Department Visits, from hospitals • Ambulance Dispatches, from 911 call centers • Lab Test Results, from laboratories
Different Types of Data from the Same Data Source For example, HMO data concerning: • Telephone Calls to Physicians • Regular Physician Visits • Emergency Department Visits • Lab Test Requests • Lab Test Results • Drug Prescriptions
Different Groupings in the Same Type of Data • Children, Young Adults, Adults age 65+ • Male, Female • Diarrhea, Vomiting
Early Work Burkom HS, Biosurveillance Applying Scan Statistics with Multiple, Disparates Data Sources, Journal of Urban Health, 80i:57-65, 2003 Wong WK, Moore A, Cooper G, Wagner M. WSARE: What’s strange about recent events? Journal of Urban Health, 80i:66-75, 2003.
Why Multivariate Detection Methods? • We do not know whether an outbreak will create a signal in one or more data streams. • The informational content is different in different data streams.
Outline • Method: Space-Time Permutation Scan Statistic • Example: Gastrointestinal telephone calls, urgent care visits and regular physician visits in Boston
The Spatial Scan Statistic Create a regular or irregular grid of centroids covering the whole study region. Create an infinite number of circles around each centroid, with the radius anywhere from zero up to a maximum so that at most 50 percent of the population is included.
Space-Time Scan Statistic Use a cylindrical window, with the circular base representing space and the height representing time. We will only consider cylinders that reach the present time.
Space-Time Permutation Scan Statistic 1. For each cylinder, calculate the expected number of cases conditioning on the marginals μst = Cs Ct / C where Cs = # cases in location s Ct = # cases in time interval t C = total number of cases
Space-Time Permutation Scan Statistic Let cst = # cases in the cylinder covering location s and time interval t.
Space-Time Permutation Scan Statistic 2. For each cylinder, calculate the Poisson likelihood Tst = [cst / μst ]cstx [(C-cst)/(C- μst)] C-cst if cst / μst > 1, Tst = 1 otherwise 3. Test statistic T = maxst log [ Tst ]
Statistical Inference 4. Generate random replicas of the data set conditioned on the marginals, by permuting the pairs of spatial locations and times. 5. Compare test statistic in real and random data sets using Monte Carlo hypothesis testing (Dwass, 1957): p = rank(Treal) / (1+#replicas)
Multiple Data Streams For each cylinder, add the Poisson log likelihoods: Tst = log[ T[1]st ] +log[ T[2]st ] +log[ T[3]st ] Test statistic T = maxst Tst
Syndromic Surveillance in Boston: Upper and Lower GI • Harvard Pilgrim Health Care HMO members cared for by Harvard Vanguard Medical Associates • Historical Data from Jan 1 to Dec 31, 2002 • Mimicking Surveillance from Sept 1 to Dec 31, 2002
Three Data Streams • Telephone Calls ( ~ 20 / day) • Urgent Care Visits ( ~ 9 / day) • Regular Physician Visits ( ~ 22 / day) Multiple contacts by the same person removed.
Strongest Signal: October 18 p= Recurrence Int. Tele: 0.001 < 1 / 1000 days Urgent 0.91 ~ every day Regular: 0.84 ~ every day Multiple DS: 0.001 < 1 / 1000 days
October 18 Signal • Friday • Number of Cases: 5 • Expected Cases: 0.04 • Location: Zip Code 01740 • Time Length: One Day
October 18 Signal • Friday • Number of Cases: 5 • Expected Cases: 0.04 • Location: Zip Code 01740 • Time Length: One Day • Diagnosis: Pinworm Infestation (all 5)
October 18 Signal • Friday • Number of Cases: 5 (all tele) • Expected Cases: 0.04 • Location: Zip Code 01740 • Time Length: One Day • Diagnosis: Pinworm Infestation (all 5) • Same Family: Mother, Father, 3 Kids
2nd Strongest Signal: December 20 p= Recurrence Int. Tele: 0.03 1 / 32 days Urgent 0.71 ~ every day Regular: 0.003 1 / 333 days Multiple DS: 0.002 1 / 500 days
December 20 Signal • Number of Cases: 16 (7 tele, 7 regular, 2 urgent) • Expected Cases: 3.5 • Location: Zips 01810,26,45,50,52,76 • Time Length: Two Days (Thu, Fri) • Strong signals on the two following days.
December 20 Signal Mostly diverse vague GI diagnoses: Esophageal Reflux (3), Nausea (2), Abdominal Pain (2), Noninfectious GI (2), Acute pharyngitis, Mastodynia, Diarrhea, Anemia, Hypertension, Blood in stool, Holiday parties?
3rd Strongest Signal: October 26 p= Recurrence Int. Tele: 0.07 1 / 14 days Urgent 0.85 ~ every day Regular: 0.18 1 / 6 days Combined: 0.007 1 / 142 days
October 26 Signal • Saturday • Number of Cases: 8 ( 5 tele, 3 regular) • Expected Cases: 0.9 • Location: Zip Codes 01902,07,15,45,70 • Time Length: Two Days (Fri, Sat) • Various specific diagnoses.
Research Funded By Methods: Alfred P Sloan Foundation Data, National Bioterrorism Syndromic Surveillance Demonstration Program: National Center for Infectious Diseases, Centers for Disease Control and Prevention
Free Software SaTScan v 5.1 www.satscan.org