A Spatial Scan Statistic for Survival Data
A Spatial Scan Statistic for Survival Data. Lan Huang, Dep Statistics, Univ Connecticut Martin Kulldorff, Harvard Medical School David Gregorio, Dep Community Medicine, Univ Connecticut. Motivation and Background.

A Spatial Scan Statistic for Survival Data
E N D
Presentation Transcript
A Spatial Scan Statistic for Survival Data Lan Huang, Dep Statistics, Univ Connecticut Martin Kulldorff, Harvard Medical School David Gregorio, Dep Community Medicine, Univ Connecticut
Motivation and Background What is the geographical distribution of prostate cancer survival in Connecticut? Are there geographical clusters with exceptionally short or long survival?
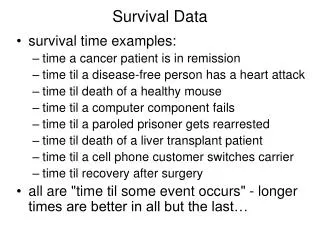
Survival Data For each person: • Time of diagnosis. • Whether dead or censored • Time until death/censoring • Residential geographical coordinates • Age • etc
Motivation and Background • Spatial scan-statistics with Bernoulli and Poisson models are designed for count data. • Length of survival is continuous data. • Survival data is often censored.
Solution Spatial Scan Statistic using an Exponential Probability Model
Methodology Spatial scan-statistic Ha: θin θout • Exponential model based spatial statistic Exponential likelihood H0: θin= θout Permutation test distribution Stat inference Hypothesis test Detect a significant cluster
Methods Evaluation • Location of 610 Connecticut prostate cancer patients diagnosed in 1984. • 47 patients in southwest Connecticut constitute a cluster with shorter survival (cluster radius: 8.65 km) • Each of the 610 patients assigned a random survival or censoring time using different distributions inside and outside the cluster
610 individuals Model Evaluation 563 47 θout - θin = θdiff 1 9 Exponential 3 7 Non-cen Gamma 10 random 5 5 censored fixed Log-normal 3 7 9 1
#individuals inside the true cluster , successfully detected for the simulated datasets without censoring s P-value<0.05 θdiff
#individuals inside the true cluster , successfully detected for censored datasets with fixed censoring time s P-value<0.05 θdiff
#individuals inside the true cluster , successfully detected for censored datasets with random censoring time s P-value<0.05 θdiff
Model Evaluation • Exponential model is robust, since the exponential based scan statistic is able to reject the null hypothesis with a low p-value when the distribution difference is moderate or large, no matter the distribution and censoring mechanism.
Application to Prostate Cancer Data • Between 1984 and 1995, the Connecticut Tumor registry recorded 22612 invasive prostate cancer incidence cases among the population-at-risk (roughly 1.2 million males 20+ years old in 1990). • 19061 records available after data cleaning. • Follow-up through December 2000. • 10308 had died and 8753 were censored.
Covariate Adjustment • Younger patients may live longer • Geographical variation in histology or stage
Discuss • Exponential model works well for censored and non-censored survival data from difference distribution, but probably no do well for all continuous variables, like data that is approximated normally distributed. • The statistical inference is valid even though the survival times are not exponentially distributed because of the permutation based test procedure.
Discussion • The covariate adjustment method here is based on the exponential model, assuming a constant hazard. It could be extended to non-constant hazard with several levels, or as a function of survival time associated with different kind of models. • It could be extends to a space-time scan statistic when time series data are available. • It could also be extended to create a scan-statistic with elliptical or other cluster shapes. • Unfortunatly, no statistical software available.