Evaluated Surface Drainage Problems with Data
Evaluated Surface Drainage Problems with Data. Charles Ellis Kent Shannon Ag Engineering Extension Specialists. Yield Map Interpretation. Man Made Variables Variety Planting date Tillage Compaction Natural Variability Soil fertility Soil type Drainage. Data Sources. Yield Data

Evaluated Surface Drainage Problems with Data
E N D
Presentation Transcript
Evaluated Surface Drainage Problems with Data Charles Ellis Kent Shannon Ag Engineering Extension Specialists
Yield Map Interpretation • Man Made Variables • Variety • Planting date • Tillage • Compaction • Natural Variability • Soil fertility • Soil type • Drainage
Data Sources • Yield Data • Aerial Photos • EC Data • Soils
Man Made Variables • Varieties • Tillage • Planting Date • Compaction • Chemical Applications • Fertilizer Applications
Man Made Variables • Varieties • Tillage • Planting Date • Compaction • Chemical Applications • Fertilizer Applications
Natural Variables Drainage Soils Soils
Man Made Variables Fertility Field History
Aerial Photos Man made variables • Compaction • Drainage Natural Variability Drainage
Image • Obtain Aerial Photos • Terraserver • FSA • www.cares.missouri.edu • Show history of field
Surface Drainage Affects • Tillage • Planting Date • Seeding Depth • Emergence • Leaching • Harvesting
Multiple Years of Yield Data Combining Multiply Years Using MapCalc Excel
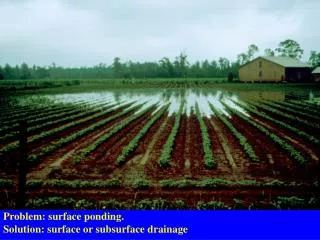
Yield and Topography Pond
Possible Solutions • Drain Pond • Remove Berm Around Pond • Drain Field After Pond Removal • Tillage to help drainage
2004 corn Yield variability has diminished. What are the causes?
Bu/A 1997 Corn Grain Yield - ASEQ Field 1; Centralia, MO
Most likely Least likely Cause of Yield Variation Seed Depth Mechanical/ Equipment Problems Nitrogen (corn) Easy Tillage Hybrid Variety Traffic Problems Planter color Weeds P & K Insects pH Ease of Remedy Plant date Population Disease Drainage Field Border Characteristics Compaction Difficult Weather Soil type Past history Organic matter Ranking of Yield Variability and Ease of Remedy Adapted from Larry Lotz, “Yield Monitors and Maps: Making Decisions”, Ohio State Univ.
Treeline and endrow compaction Topsoil variation Bu/A Low soil P and K End-row compaction Soil pH Historically managed less intensively Greater weed pressure Nearly flat, ponding 1997 Corn Grain Yield - ASEQ Field 1; Centralia, MO
RTK GPS Elevation Map 1997 Corn Yield Map
Multiple Years of Point Yield Maps 1998 Beans 1999 Corn
Multiple Years of Point Yield Maps 2000 Beans 2001 Corn
RTK GPS Elevation Map 1997 Corn Yield Map
Multiple Years of Interpolated Yield Maps 1998 Beans 1999 Corn
Multiple Years of Interpolated Yield Maps 2000 Beans 2001 Corn
Using MapCalc Software to Better Visualize Elevation Difference with Yield Data
Equipment Used for RTK GPS Data Collection Use a PocketPC computer running GPS data collection software