Download
1 / 16
170 likes | 427 Vues
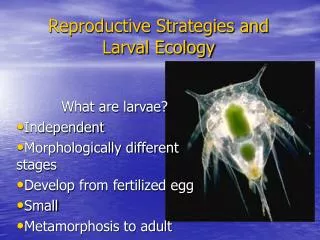
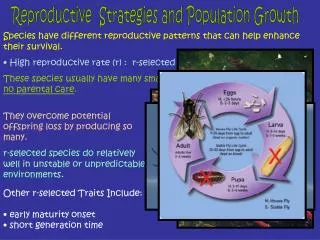
Reproductive Strategies and Population Growth. Species have different reproductive patterns that can help enhance their survival. High reproductive rate (r) : r-selected species These species usually have many small offspring, and give them little or no parental care.

E N D
Reproductive Strategies and Population Growth • Species have different reproductive patterns that can help enhance their survival. • High reproductive rate (r) : r-selected species • These species usually have many small offspring, and give them little or no parental care. They overcome potential offspring loss by producing so many. r-selected species do relatively well in unstable or unpredictable environments. • Other r-selected Traits Include: • early maturity onset • short generation time
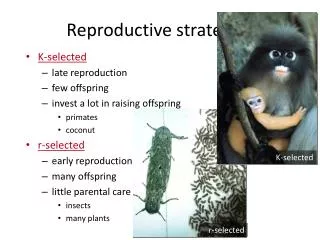
r-Selected Species • Organisms whose life history is subject to r-selection are often referred to as r-strategists. • bacteria and diatoms, • insects • weeds • semelparous cephalopods • some mammals • reptiles What exception to the rule do mammals exhibit, that none of the other groups do? They nurture and care for their young for an extended period of time. Semelparity and iteroparity are two reproductive strategies.
K-Selected Species In stable or predictable environments, K-selection predominates as the reproductive strategy. Unlike r-selected populations, where population size can change dramatically overnight, K-selection populations are typically close to the maximum that the environment can bear (carrying capacity) at most times. The ability to compete successfully for limited resources is crucial for that reason. • K-Selected Traits Include: • Large body size • Longer life expectancy • Fewer offspring • Extensive parental care
Can Organisms Be Both? • Although some organisms are identified as primarily r- or K-strategists, the majority of organisms do not follow this pattern. • Trees have traits such as large size, longevity and strong competitiveness that characterize them as K-strategists. • In reproduction, however, trees typically produce thousands of potential offspring and disperse them widely, traits characteristic of r-strategists. • Sea turtles display both r- and K-traits: although large organisms with long lifespans (should they reach adulthood), they produce large numbers of un-nurtured offspring. As mentioned earlier, mice appear to be “r” selected, but the nurturing nature of mammals is more of a “K” selected trait.
Define and give an example of an “r”-selected species. What type of advantage does being an “r”-selected species give you in an environment? Define and give an example of a “K”-selected species. What type of advantage does being a “K”-selected species give an organism in an environment? How would being semelparous give you an advantage in an environment? How would being iteroparous give you an advantage in an environment?
Calculating Growth Rates What are “crude” birth and death rates? Crude birth rate is the number of childbirths per 1,000 people per year (in estimation)…and crude death rates, similarly, are the number of deaths per 1,000 people per year.
For example, if a country has a population of one million and 15,000 babies were born last year in that country, we divide both the 15,000 and 1,000,000 by 1000 to obtain the rate per 1000. Thus the Crude Birth Rate is 15 per 1000. The Crude Birth Rate is called "crude" because it does not take into account age or sex differences among the population. In our hypothetical country, the rate is 15 births for every 1000 people but the likelihood is that around 500 of those 1000 people are men and of the 500 who are women, only a certain percentage are capable of giving birth in a given year. Crude Birth Rates of more than 30 per 1000 are considered high and rates of less than 18 per 1000 are considered low. The global Crude Birth Rate in 2012 was 20.3 per 1000. In 2012, Crude Birth Rates ranged from 8.33 per 1000 in Germany to 50.66 in Niger. The CBR in the United States in 2012 was 13.68 per 1000.
World historical and predicted crude birth rates (1950–2050) World historical and predicted crude death rates (1950–2050) Discuss projected trends of birth and death rates. What might the population pyramid for the world population in 2045-2050 look like?
% Growth Rate, or % change, is a useful indicator to look at how much a population is growing or declining in a particular area. Let’s take a look at an example: Calculate the growth rate or % change of a particular city, which had a population of 800,000 in 1990, and 1,500,000 in 2008: ( ( GROWTH RATE: Current Value – Past Value x100 Past Value So: 1,500,000 – 800,000 x 100 800,000 700,000 x100 800,000 .875 x 100 = 87.5% growth rate To calculate how that translates to a yearly annual rate, take the total growth rate, and divide it by the number of years, or 87.5% / 18 YEARS AVERAGE ANNUAL GROWTH RATE = 4.86 % ( ( ( (
Northwest High School Total enrollment at Northwest High School as of September 2008 was 3,267. The enrollment at Northwest High School for September 2012 was 2,520. What is the annual growth rate? Current value: 2,520 Past Value: 3,267 2,520-3,267 x 100 3,267 -747/3,267 x 100 -.228 x 100 = -22.8% What is the annual growth rate, if over 4 years the net growth rate is -22.8% -22.8%/4 or, -5.7% Our population is in decline! Don’t start having babies!!! ( ( As of today…our population is 2,453 students. Recalculate, based on that number. -4.98%/annum
Let's Practice Some More! In the coming years, the fifty least developed nations are expected to increase their populations greatly, from 800 million to 1.7 billion. What is the annual growth rate, if this projected increase were to take place over two decades? CV-PV x 100 PV 1,700,000,000-800,000,000 x 100 800,000,000 900,000,000 / 800,000,000 = 1.125 x 100 = 112.5% increase over 20 years Annual Average = 112.5/20 = 5.625% increase per annum. ( ( ( (
There is another way to calculate the growth rate, and it is the way you would most likely see it on the AP ES Test. Instead of using actual birth numbers, and death numbers, you would use the Crude Birth Rate, and the Crude Death Rate. (CBR and CDR). To calculate population growth rate using these figures, the formula is r=CBR-CDR
In 1855, the first year vital statistics were collected for Washington DC, the total population was 1.6 million, with a crude birth rate of 43/1,000. The population was growing rather slowly, because of the relatively high crude death rate of 41/1,000. In 1875 the growth rate increased rapidly, as the crude birth rate remained at 43/1,000, while the crude death rate dropped to 20/1,000. In 1895, the crude birth rate dropped to 37/1,000, and the death rate to 12/1,000. In that year, a census showed that the population of Washington DC had grown to 2.5 million. By 1950 the population growth had declined as the cdr remained at its 1895 levels, but the cbr had dropped to 22/1,000. In 1977 statistics showed that the cdr was at 10/1,000 and that the population growth had slowed to .4%. By 1990, Washington DC had reduced its birth rate to that of its now, low death rate. The population was in balance. What was the annual growth rate of Washington DC in 1950? What was the birth rate in Washington DC in 1977? Let’s take these questions ONE at a time!
What was the annual growth rate of Washington DC in 1950? In 1895, the crude birth rate dropped to 37/1,000, and the death rate to 12/1,000. In that year, a census showed that the population of Washington DC had grown to 2.5 million. By 1950 the population growth had declined as the cdr remained at its 1895 levels, but the cbr had dropped to 22/1,000. First Step: Write down the equation! r= cbr - cdr r = 22/1,000 - 12/1,000 = 10/1,000 or r = 2.2% - 1.2% = 1% or r = .022 - .012 = .01 The annual growth rate for Washington DC in 1950 was… As you can see, there are multiple ways to earn your points!
In 1977 statistics showed that the cdr was at 10/1,000 and that the population growth had slowed to .4%. By 1990, Washington DC had reduced its birth rate to that of its now, low death rate. The population was in balance. The question is what was the birth rate in Washington DC in 1977? You know the growth rate is .4%, and you know the CDR is 10/1,000. You don’t know the birth rate. So, set up your formula: r = CBR - CDR .4%= cbr – 10/1,000 or .4% = cbr – 1/100 or .4% = cbr - .01 (1%) So .4% = cbr – 1% (solve for cbr) .4% + 1% = cbr – 1% + 1% 1.4% = cbr Or 14/1,000 Remember, you get points for writing the equation, and working out each step. The correct answer is only worth 1 point, while the process will earn you more!
http://www.shodor.org/interactivate/activities/RabbitsAndWolves/http://www.shodor.org/interactivate/activities/RabbitsAndWolves/ • For homework tonight, and over the weekend, proceed to link above, and complete the simulation in the following manner: • Determine the original population size by clicking the “view cumulative stats” button. • Set the forest size for large • Set the forest border to island • Leave the speed alone • Start the simulation, and time it for 15 seconds. Then pause the simulation. • Select “view simulative stats”, and calculate the population growth rate for both rabbits and wolves during that period of time. Which formula will you use? r = CBR-CDR or r = cv –pv / pv x 100 ? • Now resume the simulation two more times, each in 15 second increments. Calculate new population growth rate of each population after each 15 second period. • After each population growth rate calculation, determine two possible factors that could account for such statistics. Submit all calculations and answers into moodle by next Monday! cv = current value pv – past value