VITAL STATISTICS
VITAL STATISTICS. FAJAR AWALIA YULIANTO COMMUNITY RESEARCH PROGRAM1. There is no complete agreement for all epidemiologists for the term used in this field What will be described afterward is common term that usually used, taken from Last’s Dictionary of Epidemiology. POPULATION AT RISK.

VITAL STATISTICS
E N D
Presentation Transcript
VITAL STATISTICS FAJAR AWALIA YULIANTO COMMUNITY RESEARCH PROGRAM1
There is no complete agreement for all epidemiologists for the term used in this field • What will be described afterward is common term that usually used, taken from Last’s Dictionary of Epidemiology
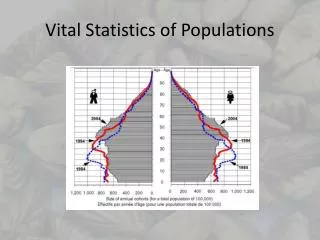
POPULATION AT RISK An important factor in calculating measures of disease frequency is the correct estimate of the numbers of people under study 0-24 yrs 0-24 yrs female 25-69 yrs male 25-69 yrs 70+yrs 70+yrs a study of carcinoma of the cervix
POPULATION AT RISK • The people who are susceptible to a given disease are called the population at risk, and can be defined by demographic, geographic or environmental factors • Examples: Occupational injuries occur only among working people, avian influenza occurs only among people handling cattle
INCIDENCE AND PREVALENCE • Incidence represents the rate of occurence of the new cases arising in a given period in a specified population • Prevalence is the frequency of existing cases in a defined population at a given point in time
If the incident cases are not resolved, but continue over time, then they become existing (prevalent) cases, prevalence=incidence x duration
If the population at risk undefined, the case numbers still useful to express the magnitude of the health events, e.g during epidemic • Attack rate ~ Incidence, used during the disease outbreak in a narrowly-defined popilation over a short period of time • Attack rate can be calculated as the number of people affected divided by the number exposed
PREVALENCE • P = (Number of people with the disease or condition at a specified time / Number of people in the popilation at risk at the specified time) X 10n • Factors determine prevalence: • The severity of illness • The duration of illness • The numberof new cases That’s why prevalence study do not usually provide strong evidence of casuality
INCIDENCE • I = (number of new events in a specified period / Number of persons exposed to risk during this period) X 10n • The numerator strictly tefers only to first events of disease
CUMULATIVE INCIDENCE • Unlike incidence, it measures the denominator only at the beginning of a study • CI = Number of people who get a disease during a specified period / Number of people free of the disease in the population at risk at the beginnig of the period X 10n
CASE FATALITY • Is a measure of the disease severity and is defined as the proportion of cases with a specified disease or condition who die within a specified time • CF = (Number of deaths from diagnosed cases in a given period / Number of diagnosed cases of the disease in the same period) X 100
DEATH RATE (CRUDE MORTALITY RATE) • CMR = (Number of deaths during a specified period/ number of persons at risk of dying during the same period) X 10n • The main disadvantage that it does not take into account the fact that the chance of dying varies according to age, sex, race, socioeconomic class and other factors • The following formulation will be diminishing the limitation of CMR
STUDY QUESTION • The crude death rate for all cancers in Japan is 241.7 per 100 000 population and the crude death rate for all cancers in Cote d’Ivoire is 70.5 per 100 000 population. Is the death rate in Japan higher than in Cote d’Ivoire?
AGE SPECIFIC DEATH RATES • Can be expressed for specific groups in a population which are defined by age, race, sec, occipation or geographical location, or for specific causes of death • Total number of deaths occuring in a specific age and sex group f the population in a defined area during a specified period Estimated total population of the same age and sex group of the population in the same area during the same period 10n
PROPORTIONATE MORTALITY • The number of deaths from a given cause per 100 or 1000 total deaths on the same period • Proportionate mortality does not express the risk of members of a population contracting or dying from a disease
INFANT MORTALITY* • It measures the rate of death in children during the first year of life, the denominator being the number of live births in the same year • Number of deaths in a year of children less than 1 year of age Number of live births in the same year 1000
CHILD MORTALITY RATE* • Is based on deaths of children aged 1-4 years • Injuries, malnutrition and infectious diseases are common causes of death in this age group • Describes the probability (expressed per 1000 live births) of a child dying before reaching 5 years of age
Child mortality rate in selected countries,2003 (per 1000 live births)
MATERNAL MORTALITY RATE • Refers to the risk of mothers dying from causes associated with delivering babies, complications of pregnancy or childbirth • Number of maternal deaths from puerperal causes in a given geographic area in a given year Number of live births that occured among the population of the given geographic area during the same year 10n
ADULT MORTALITY RATE • Define as the probability of dying between the ages of 15 and 60 years per 1000 population
Adult mortality rates in selected countries, 2004 (per 1000 population)
LIFE EXPECTANCY* • Defined as the average number of years an individual given age is expected to live if current mortality rate continue
Life expectancy atbirth for men and women in selected countries
ALHAMDULILLAH Wish every science become virtue, and every mistake become the lesson