Download
1 / 199
1.99k likes | 2.18k Vues
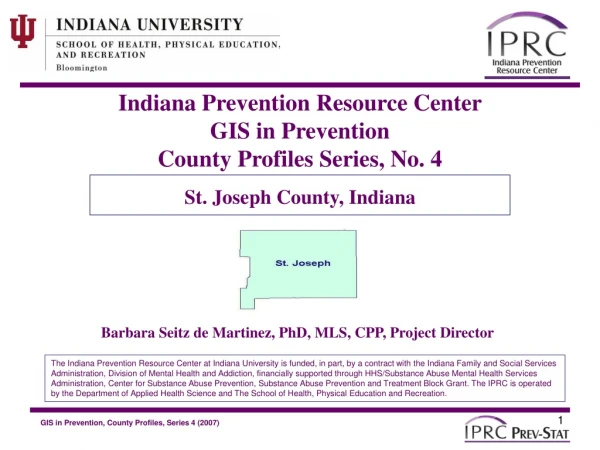
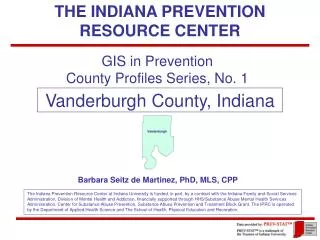
THE INDIANA PREVENTION RESOURCE CENTER. GIS in Prevention County Profiles Series, No. 1. Vanderburgh County, Indiana. Barbara Seitz de Martinez, PhD, MLS, CPP.

E N D
THE INDIANA PREVENTION RESOURCE CENTER GIS in Prevention County Profiles Series, No. 1 Vanderburgh County, Indiana Barbara Seitz de Martinez, PhD, MLS, CPP The Indiana Prevention Resource Center at Indiana University is funded, in part, by a contract with the Indiana Family and Social Services Administration, Division of Mental Health and Addiction, financially supported through HHS/Substance Abuse Mental Health Services Administration, Center for Substance Abuse Prevention, Substance Abuse Prevention and Treatment Block Grant. The IPRC is operated by the Department of Applied Health Science and The School of Health, Physical Education and Recreation.
GIS in Prevention County Profiles Series • Barbara Seitz de Martinez, Ph.D., MLS, CPP • Project Staff: • Solomon Briggs, GIS Technician • Christina Jagielski • Nan Jiang, M.S. • Jennifer Kelley, M.P.H., CHES • Nattiporn Nokkaew, M.S. • Bilesha Perera, M.Sc. • Susan Samuel, M.Sc., M.S. • Matthew Lee Smith, M.P.H., CPP • Murali Krishna Tangirala, B.A.M.S., M.P.H. Vanderburgh County, Indiana Indiana Prevention Resource Center The Indiana Prevention Resource Center at Indiana University is funded, in part, by a contract with the Indiana Family and Social Services Administration, Division of Mental Health and Addiction, financially supported through HHS/Substance Abuse Mental Health Services Administration, Center for Substance Abuse Prevention, Substance Abuse Prevention and Treatment Block Grant. The IPRC is operated by the Department of Applied Health Science and The School of Health, Physical Education and Recreation.
Vanderburgh County The maps and tables in this publication were prepared using PCensus 7.06 for MapInfo and MapInfo Professional 7.0.
Acknowledgements The completion of this project would not have been possible without the inspiration and assistance of many people and multiple agencies. The PREV-STAT™ service of the IPRC was launched from the vision of our past Executive Director, Mr. William J. Bailey, MPH, CPP, whose determination to keep the Indiana Prevention Resource Center at the cutting edge of technology led to its initiation. This current project would never have been completed without the support, information sharing, and staff assistance given by the Alcohol and Tobacco Commission, the Indiana State Excise Police Tobacco Retailer Inspection Program (TRIP), and the Indiana State Police Forensics Laboratory for methamphetamine data. It would never have been completed without the invaluable and incredible work of the staff of the Indiana Prevention Resource Center (IPRC) and TRIP, especially our student interns and hourly employees. Special thanks to Mr. James Wolf, Operations Director of the Tobacco Retailer Inspection Program (TRIP), for consultation, data sharing, and staff assistance. We also thank Ms. Penny Davis, Superintendent of the Indiana State Excise Police Alcohol Tobacco Commission. Thanks to JoBeth McCarthy-Jean and her successor as Coordinator of TRIP, Desiree Goetze, for helping coordinate exchanges of information, for advise and for arranging a meeting with James Wolf. Thanks to JoBeth and Desiree also for permitting their TRIP staff to contribute to this project. TRIP staff included student interns and hourly employees, Christina Jagielski , Jennifer Kelley, and Murali Krishna Tangirala. Special thanks as well to Officer Dave Phelps of the Indiana State Police Forensics Laboratory for sharing data on methamphetamine laboratory seizures. In addition, I thank Mr. William J. Bailey, past Executive Director of the Indiana Prevention Resource Center. While GIS software was still in its infancy, he produced a set of county profiles with demographic and local statistics for Indiana prevention professionals and practitioners in Indiana. A most heartfelt thank you to all the Indiana Prevention Resource
Acknowledgements, cont. Center staff for their encouragement and especially to the student interns and hourly staff who worked so hard on this publication, including Solomon Briggs, Bilesha Perera, Matthew Smith, Susan Samuel, Nan Jiang, and Nattiporn Nokkaew. Establishing the master template was a monumental task. Initially there was hope of finishing the entire project before the end of 2003. During the 1st and 2nd semesters of 2003, TRIP staff, Christina and Jennifer assisted by completing dozens and dozens of slides in the templates for each of the 92 counties. Bilesha Perera and Krishna Tangirala prepared the data on tobacco retail outlets for each county. Krishna prepared the TRIP data for the numbers of tobacco retail outlets and rates per thousand persons and youth, and the intensity of inspections measurement for each county. Solomon Briggs created a set of approximately 1,804 maps and 552 tables, amounting to about 3,478 pages. Bilesha prepared the FBI Uniform Crime Report arrest data and offered thoughtful and helpful editorial comments, and assisted with assembling the various sections during the final phase of production. MatthewSmith prepared gambling slides. Susan Samuel and Nan Jiang prepared alcohol-related slides. Nan also prepared other slides, proofed all 92 counties for almost all of the variables, and worked on the beginning of the final assembly process. Thanks to Josh Pugh for the design of the PREV-STAT™ logo, which appears on each page of the publication, and to unpaid student intern Nattiporn Nokkaew for her assistance during the proofing and assembly process. Thanks, too, to Richard Li, who is currently preparing online search engine access to much of this data, which when ready will become part of the Indiana Prevention Resource Center’s PREV-STAT™ Service offerings at our web site. Finally, my thanks to my husband, without whose love and encouragement I would not have had the fortitude to bring this project across the finish line, and to my son, who tried to chase me to bed, night after night when he found me working on this project well after midnight.
Background The idea for this present series and its format evolved in response to customers of the PREV-STAT™ Service, some of whom recalled the earlier County Profiles statistics produced by the IPRC. Many customers were requesting county-level data. The requests were increasing and the labor involved in each response was considerable. It occurred to me that some of that labor could be “given legs,” as they say, by creating wide and immediate access to a large pool of county level data, adding maps and tables and taking advantage of the new GIS software and data sources. Microsoft Power Point slides seemed an excellent medium, because it facilitates development of the publication and because it allows the reader/user access to the maps and tables for use in public presentations, for incorporation into grant applications, for further development of the Excel tables, and for other manipulations useful for their prevention needs. In addition to providing data, this publication serves a training function, introducing people to the IPRC and its PREV-STAT™ service and aiding understanding of how data can be applied to prevention. The County Profiles are at once an application and a training tool. They increases both the return for investment of the IPRC PREV-STAT™ staff, databases and hardware, and also the effectiveness and efficiency of prevention efforts across Indiana. In addition to expanding the number of people who know about the IPRC, its PREV-STAT™ service, and how it can assist them in their work, having these Profiles then frees the IPRC staff to respond to requests at the smaller geographic level for neighborhood and site-specific reports. These Profiles will be made available via the internet, on CD Rom, and in a very limited number of print copies.
Table of Contents Summary • Introduction: Why Environment Matters • PREV-STAT™ Overview • Geographic and Historical Notes • Protective Factors • Basic Demographics • Archival Indicators of Risk • Outstanding Characteristics • Complementary Resources • Appendices
Table of Contents 1. Introduction: Why Environment Matters 2. PREV-STAT™ Overview 3. Geographic and Historical Notes 4. Protective Factors 5. Basic Demographics 5.1 Population 5.2 Race/Ethnicity PCensus Table 1: Demographics by Block Group and Totals Total Population Average Household Income Percent of Total Population in Poverty Total Housing Units Average Age 5.3 Marital Status 5.4 Labor Force 5.5 Industry 5.6 Occupations 5.7 Educational Attainment 5.8 Households 5.9 Families 5.10 Lifestyles
Table of Contents, cont. 6. Archival Indicators of Risk Community Risk Factor: Availability of Drugs 6.1 Alcohol Sales Outlets per Capita Map 1: Schools in Proximity to Alcohol and Tobacco Outlets, 2002 6.2 Tobacco Sales Outlets per Capita 6.3 Availability of Drugs to Youth: Failed TRIP Inspections Map 2: Schools in Proximity to Tobacco Outlets That Failed TRIP Inspections Map 3: Close-up of Schools in Proximity to Failed TRIP Inspections 6.4 Proximity of Failed TRIP Inspections to Schools 6.5 Clandestine Methamphetamine Lab Busts Community Risk Factor: Community Laws/Norms 6.6 Household Spending on Alcohol 6.7 Household Spending on Tobacco 6.8 Adult Smoking Behaviors PCensus Table 2: Adult Smoking (Cigarettes and Cigars) by Block Group and Totals Map 4: Adult Cigarette Smoking (Count) Map 5: Adult Cigarette Smoking (Percent) Map 6: Adult Cigar Smoking (Count) Map 7: Adult Cigar Smoking (Percent) 6.9 Intensity of TRIP Inspections 6.10 Gambling -- Casinos and Horseracing Establishments 6.11 Adult Gambling Behaviors PCensus Table 3: Adult Gambling Behaviors (Casino and Lottery) by Block Groups and Totals Map 8: Adult Casino Gambling (Count) Map 9: Adult Casino Gambling (Percent) Map 10: Adult Lottery Gambling (Count) Map 11: Adult Lottery Gambling (Percent) 6.12 Crime Indices 6.13 FBI Uniform Crime Reports 6.14 Alcohol-Related Crashes
Table of Contents, cont. Community Risk Factor: Transitions and Mobility 6.15 Net Migration Community Risk Factor: Extreme Economic and Social Deprivation 6.16 Unemployment Rates 6.17 Free Lunches/Textbooks, K-12 6.18 Food Stamp Recipients 6.19 Aid to Families with Dependent Children PCensus Table 4: More Demographics by Block Group and Totals Percent of Population over 25 with Less Than a High School Diploma Families with Children under 18 in Poverty (Count) Single Mom with Children under 18 in Poverty (Count) Children under 18 in Poverty (Count) Households with No Vehicle Available (Count) Map 12: Percent of Population over 25 with Less Than a High School Diploma 6.20 Adults without a High School Diploma 6.21 Single Parent Family Households 6.22 Poverty: Total Poverty and Poverty by Age Group Map 13: Percent of Total Population in Poverty 6.23 Poverty: Child Poverty as Percent of All Persons in Poverty 6.24 Poverty by Race PCensus Table 5: Child Poverty Statistics by Block Group and Totals Total Children 6-11 (Count) Children 6-11 in Poverty (Count) Children 6-11 in Poverty (Percent) Total Children 12-17 (Count) Children 12-17 in Poverty (Count) Children 12-17 in Poverty (Percent) Map 14: Children 12-17 in Poverty (Count) 6.25 Poverty: Single Parent Families with Children in Poverty 6.26 Lack of Health Insurance
Table of Contents, cont. Family Risk Factor Management Problems: 6.27 Children in Homes with No Parent Present Family Risk Factor: Family Conflict 6.28 Divorce Rate Family Risk Factor: Family Attitudes and Involvement 6.29 Households Where All Parents Work 7. Outstanding Characteristics: Assets, Liabilities and Facts 7.1 Top 10% Status 7.2 Bottom 10% Status 8. Complementary Resources 8.1 IPRC's PREV-STAT™ County/Local Data Page 8.2 STATS Indiana 8.3 Statistics from the Indiana Youth Institute 8.4 The Indiana Department of Education 8.5 The Indiana Criminal Justice Institute 8.6 FBI Uniform Crime Report 8.7 U.S. Census Bureau American Factfinder 8.8 Claritas™ "You Are Where You Live“ 8.9 SAVI
Table of Contents, cont. 9. Appendices A. Census Definitions B. Claritas™ Lifestyle PRIZM Clusters C. County Distribution of Tobacco Farms D. State by County Maps E. Archival Indicators F. DSA Contact Information G. State Offices H. PCensus Tables by Block Group • County Demographics • Smoking Behaviors • Gambling Behaviors (Count, Percent) • Poverty and More Demographics • Poverty • Child Poverty
1. Introduction: Why Environment Matters Protective factors “counter risk factors and the more protective factors that are present, the less the risk.” (Hogan, et al. 2003:15) Protective factors are sometimes referred to as assets; risk factors might be better referred to as challenges, since many of the risk factors in no way suggest current or future failures or problems. For example, single parenthood can be associated with outstanding child-rearing practices and outcomes, yet no one can deny that single parents face greater challenges than do two-parent families. Risk and protective factors include individual, interpersonal, institutional, community, and cultural components, which are interwoven in our lives. Interactions and relationships between these components are complex. We know that they especially affect children and youth during their formative developmental years. Aspects of individual personality, i.e., impulsivity or timidity, predispose a child to engage in risky behaviors or to be resilient. (August 2003) Relationships with key individuals (e.g., parent, teacher, mentor and role model) strongly impact a child’s development. Also, identification with certain organizations and institutions, and interactions with additional others, provide further influence and context: “To a large extent, the outcomes of children and youth are determined by various community characteristics.” (CPRD 2001:9) DiClemente, Wingood, and Crosby suggest viewing the spheres of influence as concentric circles – individual, family, personal relationships, community and society – where behaviors are influenced within each spheres and even moreso by interactions between and among spheres. (DiClemente, et al. 2003: 367-8) The community sphere exerts influence through community norms, neighborhood/community cohesion, community prevention programs, school and institutional bonding, and social capital. The societal sphere includes such factors
as music, the media, crime and socioeconomic conditions (e.g.., “stressful environments”), which contribute to the child’s socialization and choice of behaviors. (DiClemente, et al. 2003:370-372) Life Domains Prevention professionals employ and encourage science-based prevention programs, policies and strategies that promote and support a drug-free lifestyle. (Kumpfer 1996, 1998; Webster-Stratton 1998) The norms associated with the domains in which the child grows and develops are a major object of their concern. (Webster-Stratton 1998; Thornton 2000; Oetting 1997; Chou 1998 The National Institutes of Health have identified a major protective and risk factor for each of five domains (NIDA 2003:6) or spheres of influence in which children live and develop. The risk factors can be viewed as absence of a protective factor, the consequence of that absence, or as part of a more complex scenario involving additional mitigating conditions. Where a child’s environment includes multiple risk factors, the situation becomes increasingly dangerous. Domain Protective Factor Risk Factor Individual Impulse Control Aggressive Behavior Family Parental Monitoring Lack of Parental Monitoring School Anti-Use Policies Drug Availability Peer Academic Competence Substance Use Community Neighborhood Attachment Poverty Similarly, in this County Profile, a single variable may indicate either risk or protection, depending on the county’s or block group’s score for that particular variable, e.g., variables showing various forms of assets versus deprivations. 1. Introduction: Why Environment Matters, cont.
1. Introduction: Why Environment Matters, cont. Culture By definition culture refers to behaviors and knowledge that are learned and systematic, and that are transmitted from one generation to the next. (UCSB 2004) Herskovits’ classic definition states that “culture is the man-made part of the environment.” (Herskovits 1960:17) As such, cultures are not static but ever-changing. Culture includes those non-material facets such as values, customs, beliefs and traditions passed on consciously and unconsciously to children by parents, family members, teachers, significant others, and through society via the group(s) the person belongs to and comes to identify with. Because cultures are dynamic and subject to human influence, prevention professionals and practitioners have the opportunity to intervene in a positive fashion to shape a community’s norms and culture, that is, the values, customs, beliefs and traditions related to substance use. Indeed, this is our challenge! Some examples of prevention efforts aimed at this community-level goal include policy adaptation and enforcement (e.g., to reduce youth access to tobacco and alcohol), social norms marketing, media advocacy and counter-advertising media campaigns (CPRD 2001:13-33) Some prevention efforts target an individualized environment and others a shared environment; but in either case the aim is to alter the environment to foster a healthy lifestyle and reduce or eliminate high risk behaviors. (Brounstein, et al. 1998). The social norms approach is an example of a science-based approach that is increasingly embraced by prevention (Perkins 2003:xv) It is instructive to consider the risk/protective factors associated with the five domains in relationship to the particular culture where the prevention professional is working. The protective/risk factors reveal aspects of the culture, the norms of the environment defined by that sphere or domain. A risk or protective factor may pertain to a tiny subset of the population or be typical of an entire neighborhood or larger community. In the family domain, a child is protected by an environment where parental monitoring is the child-rearing norm and an accepted cultural practice; in contrast, a child is placed at risk by an environment lacking parental monitoring. In the school domain a norm of anti-drug use (policies and enforcement) protects a child from the
1. Introduction: Why Environment Matters, cont. risks associated with drug availability. And at the community level, a protective environment is one characterized by strong neighborhood attachment, where residents feel a sense of belonging and identity, taking pride in their neighborhood. Poverty complicates neighborhood attachment because it tends to produce stress and to reduce a sense of security, working against neighborhood and community bonding. More concentrated within the individual, the protective and risk factors associated with the individual and peer domains are also highly linked to a child’s environment. In both cases, positive role-modeling and a community norm of high expectations for the child’s behavior hold significant influence. In the individual domain the protective factors of self-control and positive emotionality, versus risk factors of lack of self-control and negative emotionality, affect a child’s likelihood to engage in substance use. (Wills, et al. 2003:146-147) Parenting practices, and an environment that models and instructs children in healthy ways to handle emotions, will help children develop self-control andavoid negative behaviors. In the peer domain, norms that encourage studying, seeking parental involvement, and high expectations for academic achievement foster academic competence. In contrast, an environment where substance abuse is the norm augments the risk that a child would engage in substance abuse rather than academic pursuits. In order to be effective, prevention must target the broader environment inhabited by youth and those who would supply them with drugs (CSAP 1999:1) In these domains, prevention aims to introduce skills and practices that will support healthy norms and healthy child development.
Hence in every domain, by creating or supporting healthy norms, prevention programs help to positively influence the environment within which a child grows and develops. Karol Kumpfer enumerates critical principles of successful prevention programs. In order to be effective, prevention must be comprehensive; evidence-based; responsive to the needs, lifestyles, cultures and other characteristics of the participants; well-timed and appropriately-paced; focus on changing behaviors by teaching skills and involving peer role models; and include follow-up. The first principle of successful prevention programming is to be comprehensive, which means that it will target the primary domains and create enduring change in the social environment. (Kumpfer 2003) By teaching the child drug resistance skills, social skills, and relevant knowledge, and by modeling and fostering healthy attitudes, the prevention professional and prevention program impact the individual and her/his environment. All of the six strategies outlined by CSAP [1](Hogan, et al. 2003:30-39) aim to achieve a healthy, drug-free lifestyle. Taken as a group, used in an integrated manner based on the unique characteristics of the community or target audience and their circumstances, these strategies contribute to changing community norms. In order to have maximum effectiveness, prevention needs to be carried out with sensitivity and in such a way that behaviors change. Adding knowledge and changing attitudes are not enough. Behavioral patterns must be broken. New behaviors must be practiced. Norms must be altered. (Kumpfer [2003]) When prevention professionals select the prevention strategies that are most 1. Introduction: Why Environment Matters cont. [1] The six strategies enumerated by the Center for Substance Abuse Prevention in The Prevention Primer (1993), elaborated upon by Brounstein, et al (Western CAPT, 1998), and elaborated upon in Hogan, et al., are: 1. Dissemination of Information, 2. Prevention Education, 3. Alternative Activities, 4. Community-Based Processes, 5. Environmental Approaches, and 6. Problem Identification and Referral.
1. Introduction: Why Environment Matters, cont. appropriate for their target audience and implement those strategies with sensitivity across multiple domains, prevention has the greatest likelihood of success. (Kumpfer [2003]). Ideally, to be effective, prevention programs need to be grounded in the values that define the culture of the target audience. (Hecht, et al. 2003: 234) Environmental approaches executed with cultural sensitivity are one strategy long encouraged by CSAP, since to be culturally appropriate means to mirror the values, characteristics, preferences and expectations of the group (CSAP 2003:16). Prevention not only contributes to the individual child’s chances of thriving and remaining drug-free. Prevention also contributes to future generations by positively impacting not only current norms, but also future norms of the families, schools and communities that these children will help to create throughout the course of their life times. Clearly, a goal of prevention, like public health in general, is to understand, respect, and strengthen local culture(s) in ways that will improve health, in this case for the attainment of a drug-free lifestyle. In each domain the goals of prevention are: 1) to support and encourage behaviors and norms (customs, values, beliefs and practices) that are protective and, at the same time, 2) to discourage and reduce or eliminate behaviors and norms that place children and others at risk. However you look at it, whichever evidence-based strategies, policies and/or programs you embrace, environment plays an important role in child development. Prevention professionals, like other public health professionals, act as change agents, doing their best to make the environment in which children grow up conducive to healthy outcomes and to provide opportunities for social interactions that will foster realization of the child’s full potential for health and happiness. Success will benefit the individual child and her/his community now and in the future. It is my sincere hope that the statistics and discourse contained in this County Profile will serve you in your prevention efforts for the children of your county and our world!
1. Introduction: Why Environment Matters, cont. • Bibliography • August, Gerald J., et al. • 2003 “Dissemination of an Evidence-Based Prevention Innovation for Aggressive Children Living in Culturally Diverse, Urban Neighborhoods: The ‘Early Risers’ Effectiveness Study,” Prevention Science 4/4 (December 2003):271-286. • Brounstein, et al. • 1998 Research Findings and CSAP Strategies. Western CAPT. • The Center for Prevention Research and Development (CPRD). • 2001 Real World Prevention: A Practical Guide for Understanding Prevention and How It Can Work in Your Community. CPRD Monograph No. 5. Champaign: University of Illinois, 2001. • Center for Substance Abuse Prevention • Science-Based Prevention Programs and Principles 2002. Rockville: U.S. Department of Health and Human Services. • Chou, C., S. Montgomery, M. Pentz, L. Rohrbach, C. Johnson, B. Flay, and D. Mackinnon. • 1998 Effects of a Community-Based Prevention Program in Decreasing Drug Use n High- Risk Adolescents. American Journal of Public Health 88:944-948.
1. Introduction: Why Environment Matters, cont. Central CAPT. [2003] A Road Map for Science-Based Prevention: Participant Materials. Anoka, MN: Central Center for the Application of Prevention Technologies. DiClemente, Ralph J., Gina M. Wingood, and Richard A. Crosby. 2003 “A Contextual Perspective for Understanding and Preventing STD/HIV among Adolescents.” In Reducing Adolescent Risk: Toward an Integrated Approach. Daniel Romer, ed. Thousand Oaks, Sage. Pp. 1-7. Governor’s Advisory Panel – Family and Social Services Administration, Division of Mental Health and Addiction (FSSA/DMHA). 2004 I magine Indiana Together: The Framework to Advance the Indiana Substance Abuse Prevention System. [Overview Fact Sheet]. Indianapolis: FSSA, 2004. Grover, Prakash L., ed. 1999 Preventing Problem Related to Alcohol Availability: Environmental Approaches: PEPS 3rd ed. Prakash L. Grover, Ex. Editor. Hawkins, David J., Richard F. Catalano, Jr., and Associates. 1992 Communities That Care. San Francisco: Jossey-Bass. Hecht, Michael L., Flavio Francisco Marsiglia, Elvira Elek, David A. Wagstaff, Stephen Kulis, Patricia Dustman, and Michelle Miller-Day 2003 “Culturally Grounded Substance Use Prevention: An Evaluation of the Keepin’ it R.E.A.L. Curriculum,” Prevention Science 4/4 (December 2003):233-248.
Herskovits, Melville J. 1960 Man and His Works: The Science of Cultural Anthropology. New York: Alfred A. Knopf. Hogan, Julie A., et al. 2003 Substance Abuse Prevention: The Intersection of Science and Practice. Boston: Allyn and Bacon. Kumpfer, Karol. L. [2003] What Works in the Prevention of Drug Abuse. Southwest CAPT http://www.swcapt.org/What_s_New?what_s_new.html Kumpfer, Karol. L., V. Molgaard, and R. Spoth. 1996 The “Strengthening Families Program” for the Prevention of Delinquency and Drug Abuse.” In Preventing Childhood Disorders, Substance Abuse, and Delinquency. R.D. Peters and R.J. McMahon, eds. Newbury Park, CA: Sage. Kumpfer, Karol L., et al. 1998 “Family Etiology of Youth Problems.” In Drug Abuse Prevention Through Family Interventions. NIDA Research Monograph No. 177. Washington, DC: U.S. Government Printing Office. Pp. 42-77. Oetting, E., R. Edwards, K. Kelly, and F. Beauvais. 1997 “Risk and Protective Factors for Drug Use among Rural American Youth.” In Rural Substance Abuse: State of Knowledge and Issues. Robertson, E.B., et al, eds.; and 1. Introduction: Why Environment Matters, cont.
Rural Substance Abuse: State of Knowledge and Issues. NIDA Research Monograph No. 168. Washington, DC: U.S. Government Printing Office. P. 90-130. • Perkins, H. Wesley, ed. • The Social Norms Approach to Preventing School and College Age Substance Abuse, Jossey-Bass, 2003. • Romer, Daniel, ed. • Reducing Adolescent Risk: Toward an Integrated Approach. Thousand Oaks: Sage. • Romer, Daniel • “Prospects for an Integrated Approach to Adolescent Risk Reduction.” In Reducing Adolescent Risk: Toward an Integrated Approach. Daniel Romer, ed. Thousand Oaks, Sage. Pp. 1-7. • Thornton, T.N., et al, eds. • 2000 Best Practices of Youth Violence Prevention: A Sourcebook for Community Action. Atlanta: Centers for Disease Control and Prevention. • University of California Santa Barbara, Department of Anthropology • 2004 Anthromorphemics. http://www.anth.ucsb.edu/glossary/index2.html • Webster-Stratton, Carolyn. • Webster-Stratton, Carolyn. • 1998 Preventing Conduct Problems in Head Start Children: Strengthening Parenting Competencies. Journal of Consulting and Clinical Psychology 66:715-730. 1. Introduction: Why Environment Matters, cont.
1. Introduction: Why Environment Matters, cont. Webster-Stratton, Carolyn and Ted Taylor. 2001 “Nipping Early Risk Factors in the Bud: Preventing Substance Abuse, Delinquency, and Violence in Adolescence through Interventions Targeted at Young Children (0-8 Years),” Prevention Science 2/3 (September 2001):165-192. Wills, Thomas A. 2001 “Temperament Related to Early-Onset Substance Use: Test of a Developmental Model,” Prevention Science 2/3 (September 2001):145-164.
2.PREV-STAT™: Overview How many times have you heard or read a national or local statistic and been surprised and shaken your head because the statistic did not reflect your reality? This happens when data about very diverse realities are blended into a single summary statistic. For example, describing Marion County as the wealthiest county in Indiana overlooks the pockets of deep poverty that exist there. Geographic Information Systems help us understand data in much more minute detail, separating layers of information and suggesting relationships between those layers, such as synergies and cause-and-effect. Recently, the Indiana Prevention Resource Center launched a new, free service called PREV-STAT™ for people working in prevention in Indiana. Using GIS software and data from a variety of sources, IPRC staff create county profiles and customized project reports, including maps and tables. Users of this service include such prevention professionals and practitioners as state level officials, agency heads, teachers, community coalition members and program leaders. PREV-STAT™ enables the user to understand the characteristics of a place, to locate a group of people with particular attributes, or to study a subset of the population of a given locale. Analysis can be done at any level from the state to the county, block group, zip code, neighborhood, or based on any arbitrary selected boundaries. Alternately, a radius can be drawn around a site (e.g., a school, place of worship or prevention program) to be studied. The greatest power of PREV-STAT™ is its ability to zoom in on the very small geographic area!
2. PREV-STAT™: Overview, cont. GIS empowers the prevention landscape by attaching threads to statistics and tying them to precise locations on earth. These locations can be potentially very small, like your neighborhood or the mile radius around your school or prevention program site. GIS gives faces to the statistics by allowing you to study specific groups of people. You can ask either “Who lives here?” or “Where do they live?” Ask “Who lives here?” to learn about people in a specific area (e.g., your county, neighborhood or school district). Ask “Where do they live?” to find out about a target audience you seek to serve, (e.g., single female-headed families with incomes below $30,000). GIS in prevention helps make statistics more meaningful and persuasive. Purchased databases (e.g., from the U.S. Census Bureau, Applied Geographic Solutions-AGS, Claritas, Health Data Science) provide rich data at the community and neighborhood levels. In addition, asset information is continuously being collected to reflect local resources in the form of prevention programs and other community and youth serving agencies, organization and institutions (e.g., libraries, YMCAs, and religious institutions). Other environmental risk and protective factors represented in PREV-STAT™ include schools, alcohol outlets and locations of tobacco retailers that were found to have sold to minors, and gambling casinos.) PREV-STAT™ enhances many areas of prevention, including needs assessment, program planning, marketing and evaluation. It aids program planning by supporting decision-making regarding such issues as the goals of the program, the selection of the program site, program activities, transportation, and whether to provide (or what and when to serve) food or snacks. Information on educational attainment, plus information on local preferences for reading, listening, TV viewing, and sports participation can lead to more effective marketing strategies and the selection of more appealing activities.
2. PREV-STAT™: Overview, cont. These County Profiles offer statistics at the county level with comparisons to the State of Indiana and U.S. In addition, for many variables there are tables listing statistics by block groups (neighborhoods) for the entire county demonstrate the wide diversity that exists within each county and identifies where in the county there are assets or strengths (e.g., literacy and vehicles for transportation) and challenges or risks (e.g., child poverty). The contents of this volume are intended to advance prevention by providing statistical information for use in the various phases of the prevention process, including community readiness, needs assessment, grant-seeking, program planning, and eventually program evaluation. This series is full of information about the citizens of Indiana, living in her 92 counties: their ages; occupations; incomes; households and families; education; behaviors with regard to alcohol, tobacco, other drugs, and gambling; their assets and their hardships; their resources and their needs. Even so, the information contained in these volumes is incomplete without the insider knowledge that the residents of the counties bring to it. It is hoped that users of this volume will seek to complement this county-level information by requesting custom reports for their neighborhoods and communities from the IPRC PREV-STAT™ Service. This service is here to meet your needs. You do not need to have a precise question in mind. We will help you discover how PREV-STAT™ can help you. Just call and ask to speak to someone about PREV-STAT™.
2. PREV-STAT™: Overview, cont. Instructions for How to Access PREV-STAT™: PREV-STAT™, the IPRC GIS-in-prevention service, is available at no cost to prevention professionals and practitioners affiliated with non-profit or governmental organizations or agencies, including schools and religious institutions. Search for specific data using the PREV-STAT™ search page: http://www.pdw.indiana.edu/barb/ You can obtain copies of Indiana’s 92 County Profiles in these ways: View and print entire files or selected pages from the IPRC web site Download the entire file from the IPRC web site via the “County Profile” link at: http://www.iprc.indiana.edu/drug%5Fstats Request a copy be sent to you on CD ROM by calling or e-mailing the IPRC To obtain a custom report: Call or e-mail the IPRC to discuss your request Expect your report to be completed in approximately 3-6 weeks You can only request one report at a time Demand may limit custom reports to about three per person per year Points of access to the PREV-STAT™ Service: www.drugs.indiana.edu http://www.iprc.indiana.edu/drug_stats/county-profiles.html http://www.iprc.indiana.edu/drug_stats/county-local.html 1-812-855-1237, or, in Indiana toll free at 1-800-346-3077 seitzb@indiana.edu The IPRC is continuously working to obtain more data and to use it to produce maps, tables, slides, publications and soon searchable databases to meet your prevention needs.
3. Geographic and Historical Notes Vanderburgh County is located in South Central Indiana bordered by the Ohio River and the State of Kentucky to the south and by the following Indiana counties: Posey to the west, Gibson to the north, and Warrick to the east. U.S. Highway 41 and State Highways 62 and 66 cross the county. Elevation is 375 to 500 feet. A variety of types of terrain are found in the county: slightly sloping in the south, steeper across the west and north, and nearly level sectors near the Big Creek and Pigeon Creek tributaries on the eastern border. The landscape features hickory and oak trees. The county pertains to the Central Mississippi Valley Wooded Slopes land resource area. Vanderburgh County alternates between Central Standard Time (October to April) and Central Daylight Savings Time (April to October). Average daily temperatures are 24٥/42٥ in January and 67٥/89٥ in July. Annual precipitation is about 42 and snowfall about 10 inches. The first freeze comes first in the far northeastern sector between October 20-25, and a little later (October 25-30) across the rest of the county. The last freeze happens first (April 5-10) in the majority of the county and a bit later (April 10-15) in the northern third of the county. / The growing season lasts about 188-208 days. Agricultural activity is mainly in corn for grain and soybeans. Additional crops include hay and winter wheat. Livestock are mainly cattle/calves and hogs/pigs. About half of the land is in farms and more than four-fifths of that land is in cash crops. Important natural resources include coal, construction sand and gravel, petroleum, and forestland. Water resources include lakes/reservoirs (the largest being Clutter, Kahre, Woodland, Talahi, Schnake, and Hamilton Lakes), the Ohio River, and the Big and Pigeon Creeks. Communities include the city of Evansville, the county seat; and the town of Darmstadt. Sources: Map from PCensus for MapInfo; Geographic Notes from Indiana Facts: Flying the Colors by John Clements, 1995.
3. Location and Historical Notes Vanderburgh County is not a tobacco-producing county, according to the Strategic Development Group’s “Alternative Agricultural Strategy” (Bloomington, March 15, 2001) report, which is part of Governor Joseph E. Kernan’s “Recipient Final Reports for Office of the Commissioner of Agriculture Grant Programs” (http://www.in.gov/oca/grants/valueadd/VAFinalReports.html):
3. Vanderburgh County Block Group Maps Don’t Know Your Block Group Number? You can find it easily at the American Factfinder Web Site (www.census.gov)
Slide #1 Vanderburgh County Block Groups
Slide #2 Vanderburgh County Block Groups
Slide #3 Vanderburgh County Block Groups
4. Protective Factors in Vanderburgh County: An Overview The importance of protective factors in the environment cannot be over emphasized. They can make all the difference between positive or negative outcomes in child development. Decisions and behaviors with regard to substance use and other high risk behaviors are found to be associated with a constellation of risk and protective factors. These factors have come to be regarded as a “descriptive and predictive framework” within which prevention theory and prevention programs are elaborated. (CSAP2003:3) The web of influence which affects each individual and group includes individual, family, school, peer and community factors. Among the personal “individual” characteristics that impact decisions and behaviors are personality traits like a tendency toward sensation-seeking, mental health status, and religiosity. Influences within the family include parent-child bonding, parenting practices, parental substance use, and family size. Influences related to a child’s school experience include the quality of the bond formed between the child and school, academic performance, safety versus conflict in the school climate, and enforcement of clear policies. Pressure from peers and positive peer modeling are among peer influences predictive of abstinence from or involvement with drugs. The availability of drugs in the community, norms of use (e.g., adult use and attitudes, and community policies and enforcement), advertising and socioeconomic circumstances all contribute to the influence of community on its individual members. (CSAP 2003:4-9) These are only a few selected examples of how these factors influence youth behaviors with regard to drug use and other risky behaviors.
4. Protective Factors in Vanderburgh County: Many agencies, organizations and institutions in a child’s environment offer highly positive support and can fortify the child, reducing likelihood of high risk behaviors and substance use. Research has found that the resilience of children from very high risk circumstances is related to the protective factors which also comprise part of their environment and which have had positive impacts upon them. These children thrive in spite of negative influences and vulnerabilities. Examples of protective factors include the schools, libraries, churches, and other youth serving agencies and organizations in the child’s community. Vanderburgh County celebrates the presence in its communities of many institutions, organizations and agencies that promote healthy child development. The teachers, program leaders, librarians, religious leaders, and those who fund them deserve the sincere thanks of all the members of the community for their role in developing future generations of healthy, intelligent, caring and civic-minded citizens. The IPRC is collecting information on assets in each county. The following graph reports the number of public and private schools; libraries (including branches); places of worship; and youth serving agencies, organizations or programs which have been identified by the IPRC: Table 2.1. School data from the Department of Education, library data the Indiana State Library, churches and youth serving agencies from American Church List and FSSA (2003). CSAP. Science-Based Prevention Programs and Principles 2002. Rockville: U.S. DHHS, SAMHSA, 2003.
5. Vanderburgh County Basic Demographics Unless otherwise noted, all of the data in the Basic Demographics section comes from AGS Core Demographics, 2002 estimates, published in 2003. 5.1 Population (2002, estimates) The total population of Vanderburgh County was 172,634 in 2002, making it the 7th largest county in the state. With a land area of 234.572 square miles, Vanderburgh County has a population density of 736 persons per square mile. In addition, the county has a water area of 1.164 square miles. Median age reflects the aging of America. In Vanderburgh County median age was 32 in 1980, 37 in 2002, and is projected to be 40 by 2012. The following are 2002 estimates of population by age for children 0-17: Table 5.1: Population by Age, 2002 estimates (AGS, 2002 est., 2003)
5. Vanderburgh County Basic Demographics 5.2 Race/Ethnicity (2002, estimates) In 2002 Vanderburgh County was predominantly white (155,594 persons). The county residents also include Blacks (14,600), American Indians (307), Asian or Pacific Islanders (1,420), and Hispanics/Latinos (1,870). The following table shows Vanderburgh County’s racial/ethnic make-up in percentages compared to the rest of the state and nation: Table 5.2: Race/Ethnicity, 2002 estimates (AGS, 2002 est., 2003)
PCensus Table1:Vanderburgh County DemographicsSee Appendix for Table • Total Population • Average Household Income- 1999 Level • Percent of Total Population in Poverty • Total Housing Units • Average Age These statistics come from the U.S. Census 2000, SF3 Indiana.
5. Vanderburgh County Basic Demographics 5.3 Marital Status (2002, estimates) In 2002, an estimated 35,187 Vanderburgh County residents had never married. Another 67,393 were currently married; 10,042 were widowed; 6,443 were separated; and 18,318 were divorced. The following table shows percentages for Vanderburgh County in comparison with the state and nation: Table 5.3: Marital Status, 2002 estimates (AGS, 2002 est., 2003)
5. Vanderburgh County Basic Demographics 5.4 Labor Force: (2002, estimates) In 2002, an estimated 34 percent of persons were not in the labor force.
5. Vanderburgh County Basic Demographics 5.5 Industry (2002, estimates) The largest industry in Vanderburgh County is Manufacturing with 13,947 persons employed; followed by Health Services with 10,956 persons employed; and Retail tradewith 10,899 persons employed. Table 4 shows percentages for the top five industries relative to the state and nation: Blue collar jobs account for 49% of all workers, white collar for 51% of workers.
5. Vanderburgh County Basic Demographics 5.6 Occupations (2002, estimates) The occupations in which the highest percent of Vanderburgh County residents worked in 2002 were Administrative support occupations, including clerical(12,994); followed by Service occupations, except protective & household(11,631); Professional specialty occupations(10,528); Sales occupations(10,486); and Precision production, craft & repair occupations(9,022). The following table shows these occupations and their corresponding percentages for the state and nation:
5. Vanderburgh County Basic Demographics 5.7 Educational Attainment (2002 estimates) As of 2002, 6,611 Vanderburgh County residents aged 25 and over had not completed 9th grade; and 15,407 had some high school but no diploma. The following table shows educational attainment in Vanderburgh County compared with the state and the nation.
5. Vanderburgh County Basic Demographics 5.8 Households (2002, estimates) As of 2002, the number of households in Vanderburgh County in 2002 was 71,203. Table 8 shows median age of householders; median, average, and per capita incomes per household in comparison to the state and nation.
5. Vanderburgh County Basic Demographics 5.9 Families (2002, estimates) Of the 71,203 households in Vanderburgh County, in 2002 there were an estimated 22,362 households with children. Of these households with children, 14,100 were married couple households; 1,558 were lone parent male households; 6,416 were lone parent females; 227 were non-family male-headed households; and 61 were non-family-female headed households. Median income per family in 2002 was $53,915. The following tables shows the percent distribution by type of household with children and median family income with comparisons to the state and nation.
5. Vanderburgh County Basic Demographics 5.10 Lifestyles (Claritas™: Indiana, 2001) According to the 2001 Claritas™ PRIZM Household Summary, in Vanderburgh County, the most dominant lifestyles were C3 with 22,505 persons; C2 with 21,986 persons; T1 with 9,561 persons; C1 with 5,976 persons; and S2 with 1,950 persons. The following table shows the percentages for the most dominant lifestyles of Vanderburgh County households, and the corresponding percentages for those same lifestyle in Indiana and U.S. households. See the Appendix for descriptions of these lifestyles. See Appendix for explanation of Lifestyles Codes
5.10 Lifestyles (Claritas™: Indiana, 2001) The following table shows percentages for the five dominant lifestyles for Indiana households with corresponding percentages for lifestyles in Vanderburgh County and in the U.S. 5. Vanderburgh County Basic Demographics The following table show the percent of persons belonging to the five dominant lifestyles for households in the U.S. with the corresponding percentages of persons belonging to those lifestyles in Vanderburgh County and Indiana. See Appendix for explanation of Lifestyles Codes
Children form their opinions of human nature and the world based on their experiences and observations. For children the family is the most important institutional influence upon their socialization. (Allison and Lerner 1993) The norms of the child’s domain are critical. Children growing up in a home where parents abuse drugs (Biederman, et al. 2001), in a school where non-drug use policies are not clearly communicated and firmly enforced (CSAP 2003:7), in a community where drug use is tolerated or encouraged (Hogan, et al 2003:43) are at higher risk of becoming involved in substance use. Parenting practices are key to reducing and preventing problem behaviors in youth. (Bigan and Cody 2003:131) An important part of the family and parenting picture is parent role modeling. Parents involved in community service, parents who vote, parents who participate in their child’s life -- do make a difference.Not only do they model what it means to be a parent and an adult, they also communicate norms of behavior through example. This modeling, together with parental monitoring of children’s behaviors and the establishment of high expectations, creates a powerful influence. (Perkins 2003:9) By confronting misperceptions about norms, the social norms approach to prevention strengthens cultures by correcting misunderstandings about the beliefs and values of its members. Several of CSAP’s six prevention strategies aim to change norms and/or to correct misperceptions about them. 6. Vanderburgh County Archival Indicators of Risk Section 6 explores variables found to be associated with elevated risk for alcohol, tobacco, and other drug problems. This analysis of risk factors is based on the Center for Substance Abuse Prevention (CSAP)’s list of archival indicators as described in “Building a Successful Prevention Program” published on the Western Center for the Application of Prevention Technology (CAPT) web site. CSAP outlines four major categories of risk indicators: community, family, school and individual/peer. A full listing of archival indicators can be found in the Appendix. The Indiana Prevention Resource Center (IPRC) is aggressively pursuing the collection of data for all the archival indicators and offers here additional indicators beyond those suggested by CSAP.
Allison, Kevin W., and Richard M. Lerner • 1993 “Integrating Research, Policy, and Programs for Adolescents and Their Families.” In Early Adolescence: Perspectives on Research, Policy and Intervention. Richard M. Lerner, ed. Hillsdale, NJ: Lawrence Erlbaum Associates. • Biederman, J., Faraone, S.F., Monuteaux M. C., and Feighner, J.A. • “Patterns of Alcohol and Drug Use in Adolescents Can be Predicted by Parental Substance Use Disorders,” Pediatrics 106, 792-797. • Bigan, Anthony, and Christine Cody • 2003 “Preventing Multiple Problem Behaviors in Adolescence.” In Reducing Adolescent Risk: Towards and Integrated Approach. Daniel Romer, ed. Thousand Oaks, CA: Sage. Pp. 125-131 • Center for Substance Abuse Prevention • 2003 Science-Based Prevention Programs and Principles 2002. Rockville, MD. • Hogan, Julie A., Kristen Reed Gabrielsen, Nora Luna, and Denise Grothaus. • Substance Abuse Prevention: The Intersection of Science and Practice. • Boston: Allyn and Bacon. • Perkins, H. Wesley • “The Emergence and Evolution of the Social Norms Approach to Substance Abuse Prevention.” In The Social Norms Approach to Prevention School and College Age Substance Abuse. H. Wesley Perkins, ed. San Francisco: Jossey-Bass. • Western CAPT • 2002 Building a Successful Prevention Program Reno: Univ. of Nevada. 6. Vanderburgh County Archival Indicators of Risk
6. Vanderburgh County Archival Indicators of Risk This section discusses those CSAP archival indicators for which Indiana data is available and adds several additional related indicators. This report presents data for the following archival indicators: Category: Community Availability of Drugs Community Laws/Norms Transitions and Mobility Extreme Economic & Social Deprivation Category: Family Family Management Problems Family Conflict Favorable Parental Attitudes and Involvement