Download
1 / 1
10 likes | 151 Vues
A study using a dense seismic array to characterize the Cavola active landslide in Northern Italy, analyzing ground motion amplification, terrain properties, and wave velocities.

E N D
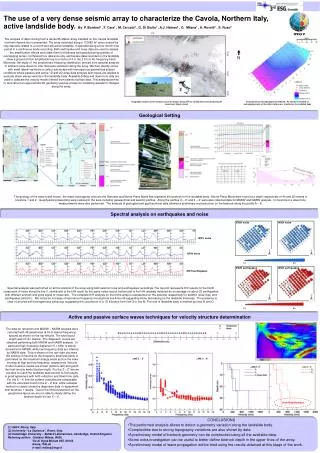
The use of a very dense seismic array to characterize the Cavola, Northern Italy, active landslide body.By P. Bordoni1 , F. Cara1 , M. Cercato2 , G. Di Giulio1 , A.J. Haines3 , G. Milana1 , A. Rovelli1 , S. Ruso2 INGV The analysis of data coming from a dense 95-station array installed on the Cavola landslide (northern Apennines) is presented. The array extended along a 112X80 m2 area covered by clay deposits related to a recent and still active landslide. It operated along a four month time period in a continuous mode recording. Both earthquake and noise data are used to assess the amplification effects and relate them to thickness and geophysical properties of outcropping terrain. Compared to a reference site, earthquake data recorded on the landslide show a ground motion amplification up to a factor of 4 in the 2.5 to 5 Hz frequency band. Moreover, the study of the predominant frequency distribution derived from spectral analysis of ambient noise allows to infer thickness variations along the array. We then identify zones with small lateral variations to select sub-arrays with homogenous geometrical subsoil conditions where passive and active 1D and 2D array data analysis techniques are applied to evaluate shear waves velocity in the landslide body. Available drilling and down-hole data are used to calibrate the velocity model inferred from seismic surface data. This analysis permits to reconstruct an approximate 2D geometry used as a base for modelling waveform changes along the array. Geographic location of the Cavola array (red triangle), along with the earthquakes recorded during the experiment (black circles) Array geometry and topography of landslide. P3 station is installed on outcropping marls, all the other stations are installed on the landslide body Geological Setting N The geology of the area is well known, the major outcropping units are the Ranzano and Monte Piano Marls that represent the bedrock for the landslide body. Monte Piano Marls were found at a depth respectively of 44 and 25 metres in borehole 1 and 2. Geophysical prospecting were realized in the area including geoelectrical and seismic profiles. Along the profiles X – X’ and Z – Z’ were also collected data for MASW and NASW analysis. In borehole 2 a down hole measurements were also performed. The analysis of geological and geothecnhical data allowed a preliminary reconstruction on the bedrock along the profile A – D. Spectral analysis on earthquakes and noise EW/H noise NS/H noise NS/V noise NS/H noise NS/H earthquakes EW/H earthquakes NS/H earthquakes Spectral analysis was performed on all the stations of the array using both seismic noise and earthquakes recordings.The top plot represents H/V results for the North component of noise along the line 3, central plot is the H/H result for the same noise record, bottom plot is the H/H analysis obtained as an average on about 20 earthquakes with different azimuth and good signal to noise ratio. The complete H/H analysis on the entire array is represented on the side plot respectively for seismic noise (top) and earthquakes (bottom) . We notice an increase of resonance frequency moving from line A line M suggesting some decreasing on the landslide thickness. The presence is clear of an area with homogeneous behaviour suggesting the occurrence of a 1D situation from line G to line M. The end of landslide body is marked by lines N and O. 1.2 6.3 1.2 6.3 Active and passive surface waves techniques for velocity structure determination Thedata for refraction and MASW – NASW analysis were recorded with 48 geophones (4.5 Hz natural frequency) spaced as shown on the top-left plot. The total layout length was of 141 meters. The dispersion curves are obtained performing both MASW and NASW analysis. In particular high frequency dispersion (f > 6Hz) is mainly derived from MASW, while low frequency data are inferred by NASW data. This is shown on the top–right plot were the picking of maxima on the frequency slowness plane is performed on the maximum energy areas and on the lower envelop at high and low frequency, respectively. Velocity model inversion results are shown (bottom–left) along with the final velocity model (bottom-right). For the Z – Z’ line we are able to reach the landslide bedrock and to find results in good agreement with both refraction and down hole data. For the X – X’ line the surface velocities are comparable with the velocities found in the Z – Z’ line, while a deeper bedrock is clearly shown by dispersion data, in agreement with borehole 1 results. Due to the limited extension on the geophones layout we are not able to clearly define the bedrock depth for line X – X’. NASWData MASW Data LINE X - X’ LINE Z - Z’ Undefined Bedrock • INGV, Rome, Italy. • (2) University “La Sapienza”, Rome, Italy. • (3) Cambridge University – Bullard Laboratories, Cambridge, United Kingdom. • Referring author: Giuliano Milana, INGV, • Via di Vigna Murata 605, 00143, • Roma, ITALIA • e-mail: milana@ingv.it • CONCLUSIONS • The performed analysis allows to detect a geometry variation along the landslide body. • Complexities due to strong topography variations are also shown by data. • A preliminary model of bedrock geometry can be constructed using all the available data. • Some extra investigation can be useful to better define bedrock depth in the upper lines of the array. • A preliminary model of wave propagation wiil be tried using the results obtained at this stage of the work.