OVERVIEW BIOLOGICAL DIVERSITY & FOREST CONSERVATION
OVERVIEW BIOLOGICAL DIVERSITY & FOREST CONSERVATION. Principles. What is Biological Diversity?. Biodiversity can be looked at different levels Genetic Species Ecosystem or biotic community Total variability of Life on Earth. Ecological Diversity biomes bio-regions landscapes

OVERVIEW BIOLOGICAL DIVERSITY & FOREST CONSERVATION
E N D
Presentation Transcript
What is Biological Diversity? • Biodiversity can be looked at different levels • Genetic • Species • Ecosystem or biotic community • Total variability of Life on Earth
Ecological Diversity • biomes • bio-regions • landscapes • ecosystems • habitats • niches • populations • Organism Diversity • kingdoms • phyla • families • genera • species • subspecies • populations • individuals • Genetic Diversity • populations • individuals • chromosomes • genes • nucleotides • Cultural Diversity • human interactions at all levels
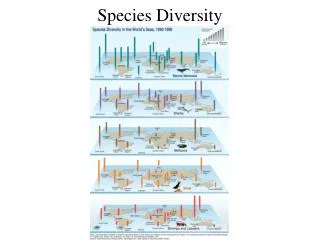
Biodiversity is measured by • Species richness ( diversity)—measures the number of species within a given area, giving equal weight to each species; • Species diversity—measures the species in the area, adjusting for both sampling effects and species abundance; • Taxic diversity—measures taxonomic dispersion of species; emphasizing evolutionarily isolated species that contribute to the assemblage of features;
Cont. • Functional diversity – the richness of functional features and inter-relations in an area, e.g., food webs, keystone species, guilds; • Diversity across communities/ecosystems ( diversity); and • Systems diversity – richness of ecological zones/ecosystems in a region or landscape.
Major features of tropical biodiversity • Intense species richness; • Very high rates of endemism and rarity; • Large number of congeneric species; and • Unique species assemblages in specialised habitats.
Australia (7.68 m km2) Brazil (8.55 m km2) China (9.57 m km2) Colombia (1.14 m km2) Ecuador (0.27 m km2) Democratic Republic of Congo (2.35 m km2) India (3.16 m km2) Indonesia (1.90 m km2) Madagascar (0.59 m km2) Malaysia (0.33 m km2) Mexico (1.96 m km2) Peru (1.28 m km2) The 12 Mega-diversity Countries of the World
Ecosystems (terrestrial) Major tropical and sub-tropical forest formations are divided into : • Climatic Climax Forests • Edaphic Forests
Example:Malaysia Relief Map
Climatic climax forests in Malaysia • Lowland dipterocarp forest; • Hill dipterocarp forest; • Upper hill dipterocarp forest; • Mixed dipterocarp forest; • Tropical lower montane forest; • Tropical montane forest; • Tropical subalpine forest; and • Tropical semi-evergreen forest.
Edaphic Forests • Heath or Kerangas forest; • Forest over limestone hills; • Forest over ultramafic/ultrabasic outcrops; • Quartzite vegetation; • Riparian vegetation; • Beach strand vegetation; • Mangrove swamp; • Peat swamp forest; • Freshwater swamp forest; • Brackish-water forest; and • Seasonal swamp forest.
Plant Geography Why is a plant species distributed as such? Factors influencing distribution Biological factorsRates of reproduction: high / low fecundity; Extent & modes of dispersal Ecological factorsOrganism interactions incl. synergisms and antagonisms, e.g., host-pathogen, herbivore-herb, plant-pollinators; Tolerance for environmental changes Geographical factorsDistance of site from source areas; Size and complexity of area Geological factors Earth tectonic history; past climate change; paleobotanical evidence
Plant BiogeographyExample: Malaysia Borneo Wong (1998) recognised 3 major phytogeographical regions in Borneo • Riau Pocket • East coast Sabah sub-province • Seasonal Asiatic-Australasian intrusion in north Borneo • Malaya • Riau Pocket • West coast region with Perak sub-province • Burmese-Thai floristic element
Within Malaya • Perlis and Langkawi (Seasonal climate in the NW) • Bintang & Keledang Ranges • Northern Element • Main Range • West Coast • South Malayan • East Coast
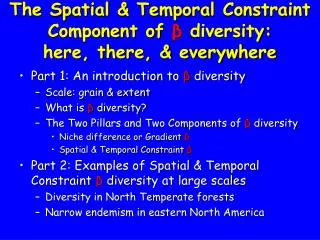
Generalised Patterns of Distribution(based on geographical range, habitat selection & local population sizes) (after Rabinowitz, 1981) • Locally abundant, widespread, in many habitats versus constantly sparse, widespread, in many habitats (Example 1); • Locally abundant, widespread, in specific habitats versus constantly sparse, widespread, in specific habitats (Example 2);
Cont. • Locally abundant, restricted geographically in several habitats vs. constantly sparse, geographically restricted in several habitats (Example 3); and • Locally abundant restricted geographically in a specific habitat vs. constantly sparse in a specific habitat, restricted geographically (Example 4).
Example 1(Locally abundant, widespread, in many habitats versus constantly sparse, widespread, in many habitats ) Shorea leprosula (Dipterocarpaceae) –locally abundant; Peninsular Thailand, Sumatera, Malaya & Borneo; forests up to 700 m asl. Vs. Aquilaria malaccensis (Thymelaeaceae)–sparsely distributed; India, Burma to Malesia; forests up to 750 m asl.
Example 2(Locally abundant, widespread, in specific habitats versus constantly sparse, widespread, in specific habitats ) Gonystylus bancanus (Thymelaeaceae)–locally abundant; Sumatera, Malaya & Borneo; peatswamp & seasonal swamp forests vs. Myristica lowiana (Sapotaceae) – sparse; Sumatera, Malaya, Borneo; peat swamp forests.
Example 3(Locally abundant, restricted geographically in several habitats vs. constantly sparse, geographically restricted in several habitats) Hopea bilitonensis (Dipterocarpaceae)– locally abundant; restricted to southeast Sumatera & west central Peninsular Malaysia; lowland forests and on limestone Vs. Neobalanocarpus heimii (Dipterocarpaceae)– sparsely distributed; restricted to Peninsular Thailand & Peninsular Malaysia, widespread in dipterocarp forests below 1000 m asl.
Example 4(Locally abundant restricted geographically in a specific habitat vs. constantly sparse in a specific habitat, restricted geographically) Begonia kingiana (Begoniaceae)– locally abundant, endemic to Peninsular Malaysia; limestone. vs. Begonia aequilateralis–sparsely distributed; endemic to Peninsular Malaysia; riparian fringes
Some examples in Peninsular Malaysia–Dipterocarpaceae Widespread Distribution Shorea guiso Shorea parvifolia ssp. parvifolia
East Coast Distribution Shorea falcifera Shorea materialis
Southern Distribution Shorea johorensis Shorea belumutensis
North-west Distribution Shorea henryana Shorea siamensis
Narrow Endemics 7 N 7 N 6 N 6 N 5 N 5 N 4 N 4 N 3 N 3 N 2 N 2 N 1 N 1 N 100 101 102 103 104 100 101 102 103 104 E E E E E E E E E E Shorea lumutensis (Balau puteh) Hopea subalata (Giam kanching)
Rare and Endemic Taxa • Endemic • Widespread • Very narrow distribution • Rare but non-endemic • Widespread • Very narrow distribution including single-locality population
Gene pool/niche interaction theory (Stebbins 1980) The primary cause of localised or endemic distribution patterns is adaptation to a combination of ecological factors that are themselves localised. Factors of soil texture or chemical composition are the most common but by no means the ones. Next to climatic and edaphic factors, those inherent in the gene pool of the population are of critical importance. They include the total amount of variability, the amount of variability that can be released at any one time and the amount of variation that can be generated with respect to those particular characteristics that affect most strongly the establishment of new populations.
Types of endemics • Paleoendemics – ancient vestiges of taxa that were once more widespread. Their present relictual status is the result of an increasing constriction of their specialised habitats over time; • Neoendemics – are recent in origin, have just split off from a parental entity and maybe poised for further expansion of their ranges and gene pools.
Floristic diversity and endemism in Asia, Australasia & the Pacific *very approximate estimate
Three Essential Elements* • Conservation of biological diversity • Sustainable use of its components • Equitable sharing of benefits * Enshrined in the Convention of Biological Diversity
Conservation The preservation or maintenance of some or all of the components of biological diversity including sustainable use of the components or their recovery or restoration
Sustainable Use The use of components of biological diversity in a way and at a rate that does not lead to the long-term decline of biological diversity, thereby maintaining its potential to meet the needs and aspirations of present and future generations
Underlying causes of biodiversity loss • Population expansion; • Poverty; • Market & trade; • Introduction of alien species; and • Macroeconomic policies.
Threats to biodiversity loss • Habitat loss and degradation due to urbanization, agriculture, infrastructure development (e.g. dams). Leads to fragmentation and isolation; • Over-exploitation & unsustainable harvest of biological resources either to sustain food supply, livelihood or trade; • pollution of air, water and soil; • introduction of alien (i.e., non-indigenous) species; • climate change and stratospheric ozone depletion; and • Natural catastrophes such as wildfire, tsunamis, hurricanes etc.
Fundamental challenges • How do we balance socio-economic forces with conservation? • What are the legislative and policy measures required to achieve the above balance? • How can we use and co-ordinate current available data on biodiversity for strategic planning?; • How to deploy available but often very limited human and financial resources?; and • How can the country’s policy makers integrate conservation into development programmes?.
What do we conserve? Three levels of biological diversity must be captured in any conservation programme : • Genetic • Species and • Ecosystem or biotic communities. • Identifying Priorities • Habitat • Species
Precautionary principle Policy makers should approach cautiously when making interventions in the natural environment so as to safeguard against unexpectedly severe future costs.
Region Land area (million ha) Total forest (natural & plantations) Area (million ha) % land area % world’s forest Africa 2,978 650 22 17 Asia 3,085 548 18 14 Europe 2,260 1,039 46 27 North & Central America 2,137 549 26 14 Oceania 849 198 23 5 South America 1,755 886 51 23 Total 13,064 3,869 30 100 Forest area by region (2000) Source : Anon (2001). State of the World’s Forest. FAO.
Distribution of forests by ecological zone (2000) (see also word table)
Example: Peninsular Malaysia Net change in forest areas (1960 to 1990) 1962