Download
1 / 62
690 likes | 951 Vues
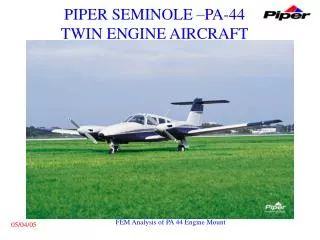
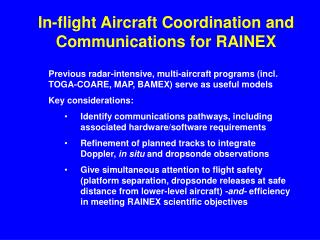
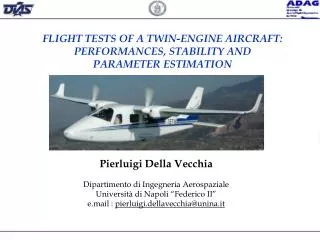
FLIGHT TESTS OF A TWIN-ENGINE AIRCRAFT: PERFORMANCES, STABILITY AND PARAMETER ESTIMATION. Pierluigi Della Vecchia Dipartimento di Ingegneria Aerospaziale Università di Napoli “Federico II” e.mail : pierluigi.dellavecchia@unina.it. Layout of the presentation.

E N D
FLIGHT TESTS OF A TWIN-ENGINE AIRCRAFT: PERFORMANCES, STABILITY AND PARAMETER ESTIMATION Pierluigi Della Vecchia Dipartimento di Ingegneria Aerospaziale Università di Napoli “Federico II” e.mail : pierluigi.dellavecchia@unina.it
Layout of the presentation • Overviewof the Tecnam P2006T aircraft • Flight testsinstrumentation • Flight testscertification • Stability and flight qualityevaluation • Aircraftparameterestimation
P2006T Aircraft Characteristics CS-23 Certification Engine:Rotax 912S (2100 hp) Weights & Balance Performances
Wind tunnel tests DIAS low-speedwind tunnel Test section: 2 m 1.4 m TurbulenceIntensity 0.1% Max. speed 45 m/s Scale Model (1:6.5) Fluorescent oil film visualizations Re ≈ 0.6106 In-Flight Re ≈ 6.0106 Transition strips
Wind tunnel test results Pitching moment coefficient, measured for a fixed transition on wings, nacelles and fuselage and a reference Reynolds number of 0.6106, at different stabilator deflection angles s AIAA Aircraft Flight MechanicsConference, Toronto, August 2010
Wind tunnel test results Roll Side-force Lateral-directional coefficients, measured for a fixed transition on wings, nacelles and fuselage and a reference Reynolds number of 0.6106, at different rudder deflection angles r Yaw AIAA Aircraft Flight MechanicsConference, Toronto, August 2010
Flight Performances and certification • Flight testscarried out • to complete aircraftcertification • torelease flight manual • aircraft set up
Flight data acquisition system Box Megaris (PC) AHRS GPS Antenna Pitot probe Flag Flag Mini Air DATA Boom Aileron deflection
Flight data acquisition system Closetoc.g position LOAD CELLS AHRS COMPUTER A/C Total Pressure Probe MINI AIR DATA BOOM
P2006T Flight Perormancesand certification • Flight testscarried out • to complete aircraftcertification • torelease flight manual • aircraftset up In thispresentation: • Pitot-static system calibration • Stalltests • Climb (AEO , OEI) tests • Take-off tests • StaticStabilitytests
Pitot-staticsystem Calibration Calibration curve Speed course method together GPS measurements: - a series of courses over a base of known length Results summary
StallTests - Requirements CS 23.49 and CS 23.201 • starting from a speed at least 10 ktsabove the stall speed • longitudinal control must be pulled back • rate of speed reduction will not exceed 1 knot/s(level stall) and 3 knots/s(turning stall) Testshavebeenperformed in the followingconfigurations and conditions: • Maximum weight take off; • Engine running at 75% and idle • Flap a 0°, 15° and full; • Landing gear retracted and extended; • Trim speed (=1.5VS1). • CG in the max forward and aft position. • Turning stall with 30°of bank …leadingto more than 100 stallstoaccomplishcertificationrequirements!
StallTests Level stall time histories – NO FLAP Level stall time histories – FLAP landing
StallTests-Results ENTRY RATE EFFECT Level stall time histories – no FLAP Xcg 16.5% MAC (max forward)
StallTests - Results …morethan 100 stallshavebeenperformed ! (CAS) Vs_clean = 56 kts (CAS) Vs_take_off = 51 kts (CAS) Vs_landing = 47 kts P2006T certifiedstallspeeds
CLIMB WINGLETS not installed Aircraft during pre-certification tests b = 11.2 m S =14.7 m2 WINGLETS installed b = 11.4 m S =14.8 m2
CLIMB - OEI NO WINGLETS WINGLETS Rate ofClimb (at 800 ft) 169 ft/min Rate ofClimb (at 800 ft) 300 ft/min Pilots reported an huge difference in climb capability of the aircraft!
CLIMB - AEO Flight certificationtests • SAW-TOOTH CLIMB • 2 referencealtitude (800ft and 5000 ft)
CLIMB – AEO&OEI AEO Steepestclimbspeed Fastestclimbspeed OEI Steepestclimbspeed Fastestclimbspeed
CLIMB – AEO&OEI AEO AEO OEI OEI
TAKE-OFF • Ground Phase S1 • Air Phase S2 STO = S1+S2 • Requirements: CS 23.51 – 23.53 • VR > 1.05 VMC(55.8 kts) or 1.1 VS1(56.1 kts) • V50 > 1.1 VMC(58.3 kts) or 1.2VS1(61.2 kts) • Flap take - off, landinggear down , maximumpower • MaximumWeight, Xc.g.maxforward
TAKE-OFF Ground Phase recontruction Lift off point Pickets Air Phase reconstruction
TAKE-OFF TAKE-OFF reconstruction 50 ft
TAKE-OFF- Results Results meet the demands V_R> 56.1kts; V_50 = V_obs> 61.2kts; STO = 383 m
StaticLongitudinalStability Aircraftequippedwihtaninstrumentationtomeasurepilotefforts Centreofgravitypos. mustbe the mostunfavorable Aircraftconfiguration during the tests Loadcells All flight tests show that the aircraftisstable (statically) !
StaticLongitudinalStability • CS 23.173 –CS 23.175 • it must be demonstrated that: • “a pull must be required to obtain and maintain speeds below the specified trim speed, and a push required to obtain and maintain speeds above the specified trim speed” • “the airspeed must return to within 10% of the original trim speed when the control force is slowly released from any trim speed”. • a stable slope of stick force is required V_trim = 100 kts Cleanconfiguration Level flight
P2006T Stability StaticLongitudinalStability Demonstration of Static Longitudinal Stability: example during a climb Speed returns to the trimmed speed (<10%) Stable slope of stick-force curve
Neutralpoint Neutralpoint position Stick-fixed
Staticlateral-directionalstability Steady-headingsideslip Aircraftmustbestabilized, withwingleveled at highersideslipangleswithailerons and ruddercontrol, withoutparticularelevetorcontrolvariation sideslip aileron rudder bank
- DYNAMIC STABILITY - SYSTEM IDENTIFICATION
AircraftDynamicStability • Longitudinaldynamicstability • Short period welldamped , oscillation in α • Phugoid slightlydamped, osclillation in altitude • Lateraldirectionaldynamicstability • Roll welldamped, notoscillatory • Spiral almostneutral, very slow motion • Dutchroll damped, combination in roll and yaw
Manoeuverstoexcite the aircraftmotion • Itisessentialthat the dynamicresponseexhibitsfrequency and dampingof the oscillatorymodes. • Itisrecommendedto start eachmanoeuvrefrom a trimmedlevelflght, and allow 5-6 s beforeapplying a specifinputs, and, dependingupon the mode ofmotion, toallowsufficienttimeafter the input toallow the aircrafttoascillate.
Manoeuverstoexcite the aircraftmotion • Engineeringapproach • multistepinput signalsbased on the frequencycontent energyspectrum normalizedfrequency total durationof the input consistingof N impulseseachofduration amplitudeoffor the current input
Manoeuverstoexcite the aircraftmotion Suitablefor Phugoid(T = 25-30 sec. f =0.2-0.3 rad/sec) Suitablefor Short Period=2-3 sec. f =2-3 rad/sec)
Manoeuvrestoexciteaircraftmotion • STEP ? • Δt_DOUBLET = 1/2.7 *Periodofoscillation • Δt_3211 = 1/4 * Periodofoscillation • Δt_SINGLE_Impulse = 1/6 * Periodofoscillation
Short period mode evaluation Maximum slope (MS) method, used to estimate the short period natural pulsation (Kimberlin; Ward and Strganac) Typical short period response angle-of-attack time history, as a response to a ‘3-2-1-1-type’ stabilator input
Short period mode evaluation Averaged damped oscillation parameters in the imaginary plane, extracted from a number of time histories (excited by ‘3211-type’ longitudinal command input) SP = 1 / Z = m / ( Q0SCL ) CAP = n,SP2 / n ≈ mg n,SP2 / ( Q0SCL ) = 1.009 Within Level 1 range (Class I-B, MIL-STD-1797A)
Dutchroll mode evaluation Single pedal doublet multiple pedal doublets Sideslip variation, with respect to a trimmed condition in level flight at 110 kts. Ph is calculated using the transient-peak-ratio (TPR) method
System Identification • Detemining the characteristicsof a system(the aircraft) through a seriesof BASIC PARAMETERS
System Identification-Approach • Numeric(CFD – SemiempiricalFormulas) • Sperimental(Wind tunnel tests- Flight tests)
SperimentalApproachFlight Tests Modelreconstructionthrough the aircraft flight testsmeasuredresponse. • I fattori che determinano l’attendibilità dei parametri sono: • dati raccolti (Data Gathering) • modellopostulato (Postulated Model) • algoritmo di analisi (Output ErrorMethod)
Data Gathering - Aspetti cruciali • Affidabilità del Sistema di acquisizione • Definizione dello scopo dei test • Definizione di una opportuna sequenza di manovre da effettuare • Scelta di una forma adeguata di input per eccitare il moto del velivolo in maniera ottimale
Modello postulato • Modello nello Spazio degli Stati • Equazione della dinamica del volo • Problema di valori iniziali • Metodo di Runge-Kutta al quarto ordine
Algoritmo di AnalisiMetodo di Output Error Il codice utilizzato come post processing per l’Identificazione dei parametri del velivolo dalle prove dinamiche in volo è stato realizzato dal Prof. Ravindra V. Jategaonkar e si basa sul metodo OEM.
Algoritmo di AnalisiPrincipio della Massima Verosimiglianza L’esperimento dipende da k parametri per i quali i valori osservati, contenuti nella matrice delle osservazioni z, sono i più probabili tra quelli stimati, a loro volta contenuti nella matrice delle variabili stimatey matematicamente, bisogna massimizzare la funzione di verosimiglianza