Download

1 / 40
440 likes | 657 Vues
Vehicular Fuel Consumption Simulation and Measurement Dr. Horizon GITANO-BRIGGS University Science Malaysia . Challenges of Field FC and Emissions . Page 2 of 32. Individual Vehicle Variation Environmental Factors (Temp, Rain…) Driver Factors (Aggressive, slow)

E N D
Vehicular Fuel Consumption Simulation and Measurement Dr. Horizon GITANO-BRIGGS University Science Malaysia
Challenges of Field FC and Emissions Page 2 of 32 Individual Vehicle Variation Environmental Factors (Temp, Rain…) Driver Factors (Aggressive, slow) Load Factors (Hills, passengers) Traffic Factors (Jammed, or free flowing) Variation from vehicle to vehicle (identical units) Tuning, Wear, part-to-part variation Model to Model variation Geographic Location Variation Hills, Loads, Traffic, …
Vehicle FC Modeling Page 3 of 32 Speed-Load model is useful and fairly accurate –but- • No acceleration load prediction (can be included, but based on what acceleration?) • No Hill prediction (again can be included, but what is the topology?) • Gearing can be included, but depends on shift speeds • Shift speeds vary by ~2x depending on driver aggression (3000rpm up shift mellow, 6000 racing) Vehicle tuning: still need some engine data
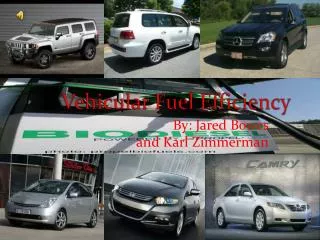
Vehicle Power Modeling Vehicle Models can be good predictors of power. They are less accurate at fuel consumption prediction. Page 4 of 32
Individual vehicle FC Variation Page 5 of 32 Vehicle Load con not directly predict FC Relies on knowledge of engine operating point and efficiency • Efficiency varies widely based on individual vehicles operation point (speed vs. torque) even at same power
Effect of Rider Stance, Load, Tire Pressure Individual vehicle Power and FC 20% ↑ FC 2 x ↑ Power Page 13 of 29
FC Review Page 7 of 32 Power = Torque x Speed FC = Power x BSFC (Break Specific Fuel Consumption, gm/kWh) Car on highway: 15Nm, 6000 rpm, BSFC = 600 gm/kWh P = 15 x 6000 x 2π / 60 = 9.4kW FC = 600 * 9.4 = 5640 gm/hour FC = 5640gm / 720gm/liter = 7.8 liters/hour 100km/h => 7.8l/100km => 13km/liter
Engine BSFC (gm/kWh) 270 280 290 Engine Torque 300 350 400 800 Engine Speed Page 8 of 32 Maximum Torque Curve (WOT)
Constant Power Curves Engine Torque Engine Speed Page 9 of 32 Power: 1 2 3 4 6 8 kW
Various Gear Ratios 290 4th Engine Torque 300 3rd 350 2nd Engine Speed Page 10 of 32 For same power BSFC varies from 290 to 350 (ie. 20%)
Engine Technology Page 11 of 32 Not all technologies will have similar patterns of FC or emissions (ie. it is hard to generalize FC/Emissions results) Different technologies give different variations of FC • Carbureted 2T loses ~35% of fuel unburned typically • At idle it may be >70% due to miss-firing • Direct Fuel Injection can run exceptionally lean ay idle - Stratified Gasoline vs. LPG leakage • LPG: Based on 1 study ~60% of tanks/systems had significant leaks • Gasoline systems will have fewer leaks as more noticeable, but suffer from more “pilferage”
Idle Combustion Pressure Comparison 3 x misfires 3 x misfires Late combustion Direct Fuel Injection: More consistent Page 12 of 32 Carbureted: fires 1 out of 4 cycles
Fleet Vehicle FC Variation Page 13 of 32 Variation: Gearing, Tire Size, Replacement Parts, Wear • Vehicle tuning varies (7% are grossly mistuned) • Driver behavior variation: 2x variation in acceleration One study found FC ok in city but bad in rural because gearing was the same, and engines were revving too high for rural highway speeds Re-geared for highway speeds and FC greatly improved • Probably require>30 vehicle samples for any reasonable estimates
Dyno vs Road Testing Page 14 of 32 Obvious environmental factors: Temp, rain, road surface • 2ndary: Engine temps • Even with careful control may still have ~10% variation (road – dyno) • While dyno tests may not give exactly the same FC numbers as road tests, they are pretty good at vehicle to vehicle comparisons Strive to get a dyno test to match the road FC, but don’t stress! The vehicle to vehicle comparison should still be valid unless the dyno test is totally inappropriate!
Dynamometry Measurements: good for comparisons Fuel economy of 4-stroke and 2-stoke motorcycles Vehicle fuel economy as function of motorcycle age Page 24 of 29
Dynamometry Measurements: good for comparisons Fuel economy versus engine size Fuel economy by manufacturer Page 25 of 29
Dynamometry Studies part throttle resulting in high pumping losses extra work done to overcome the larger aerodynamic drag Optimum speed for best FE Some studies are much easier to do on a dynamometer Page 15 of 29
Dynamometry Studies Optimum speed for best FE Technology comparison: Carb vs EFI Page 15 of 29
Drive Cycle Comparison ECER40 M’sian Urban Cycle M’sians accelerate more aggressively, faster and spend less time stopped Page 19 of 32
Drive Cycle Analysis: Malaysia 600 motorcycle survey Average mileage 5500km/year Similar speeds and accelerations Page 20 of 32
FUEL CONSUMPTION COMPARISON: Chassis Dyno vs. On-Road The vehicle was transient dyno tested on a representative drive cycle, and compared with on the road fuel consumption for that mode of driving. Typically there is a 10% difference between the 2 methods. Page 21 of 29
Fuel Consumption and Emissions Factors Typical “balanced” drive cycle => 42.8 km/l Annual mileage ~ 5,500km/year 128.5 l/vehicle per year 5,000,000 bbl/year total fuel consumption by motorcycles in Malaysia Typical emissions (New carbureted small 4T motorcycles): gm/km kg/vehicle/year kTons/year (Msia) CO: 7.0 38 308 HC: 0.7 3.8 31 NOx: 0.15 0.83 6.6 CO2: 50 275 2200 Page 22 of 32
Effect of Technologies: Carb vs EFI Even if the test pattern doesn’t match the road cycle exactly, the differences between various technologies should be obvious: Emissions (gm/km) on the ECE-R40 Test: CarburetedEFI CO: 7.0 1.1 HC: 0.7 0.24 NOx: 0.15 0.08 CO2: 50 55 Page 23 of 32
Field FC Measurements Page 24 of 32 Individual tank fill-ups variation is large (>10%) • Probably requires ~10 tank fills (Empty to Full 10x) • Data taking sometimes questionable (does the recorder care about data quality?) Running with a calibrated fuel bottle will give accurate results for a given drive. This is SOP for Shell Eco Marathon and similar “eco races”.
Field Vehicle Measurements Page 25 of 32 GPS is ok for speed, but it may overestimates speed when slow (dither) • Wheel sped pick better: gives good V and A and distance • No hill, no load info Simple, inexpensive data loggers can track a vehicles movement for months with high resolution.
Data Collection: Wheel Speed pickup Target Sensor • Data from the speed pickup is stored in the portable data logger at 10Hz and later downloaded into the computer. • RPM vs Time Inductive sensor reads signal from 2 targets on rear wheel, 180 degrees apart Page 26 of 32
Motorcycle Roll Down Test: GPS vs Wheel Speed Notice Model and Wheel Data overlay (good agreement) Aerodynamic resistance dominates Rolling resistance dominates Page 9 of 29
Instrumentation: Advanced Concepts Outer section is separate from inner section. Torque compresses springs, allowing outer section to rotate with respect to inner section. Features on both sections are detected by speed pickup. Page 28 of 32 Torque sprocket: Measures both speed and torque at wheel • Includes hill and load effects (but not engine efficiency) • Torque Spkt + engine speed (from generator signal) can be decent predictor of engine operating condition (speed torque) and thus FC
Instrumentation: Advanced Concepts Page 29 of 32 Torque sprocket: Speed, Torque, and Acceleration (from V)
Instrumentation: Advanced Concepts Page 30 of 32 In fuel injected vehicles the ECU “knows” how much fuel is being injected. OBD 2 (On Board Diagnostics) Vehicles can have FC read directly from the ECU On non-OBD EFI systems Injection Duration can easily be measured and combined with injector calibration to get a good FC number Carbureted vehicles can be instrumented with EFI sensors: • Measure engine speed and throttle position • Can back-calculate FC accurately if you have “mapped” the engine
Instrumentation: Advanced Concepts Injector Signal Flow Rate Delivered Fuel Injector Signal Duration Page 31 of 32 In EFI systems the injector does not open or close instantly. The injector calibration curve will give the fuel delivered based on an injection duration (signal) including both of these effects.
Instrumentation: Advanced Concepts Page 32 of 32 2-T LPG EFI used for fuel tracking in bi-fuel motorcycle. In gasoline mode (carbureted) can record info for gasoline FC via separate calculation
Implications for CDMs Page 33 of 32 Vehicle Measurement are crucial: Wheel speed pickup V and A, and distance are reliable Measuring Torque and speed we can estimate FC well Engine Measurement are getting better: TPS + Engine Speed, and Temp With a “calibrated” vehicle we can accurately get the FC Higher Resolution data, but on a limited number of vehicles? Road “gas bottle” test still most reliable: Still will have some variation so need several runs. ~30 vehicles to get a good idea of the FC for a given senario.
Conclusions Page 34 of 32 We can (and should) use standard tests to compare the emissions/FC benefits of various technologies These tests should be as close to the real operating conditions as possible although standard (ie. dyno) tests may not correlate perfectly with field tests Field tests are a good idea (for final confirmation) but must be well controlled: • Fuel metering should be very carefully controlled • Environmental conditions, loads, speeds, … should all be controlled In-Stitu Instrumentation for monitoring actual usage is probably the best way to go in the long run. This may require further development of instrumentation.
Contacting Us For more information please contact us via: University Science Malaysia HorizonUSM@yahoo.com Focus Applied Technologies Lot 1174 Jalan Hutan Lipur Kpg. Sg. Buaya Nibong Tebal 14300 Penang, Malaysia + (6016) 484-6524 (Voice) +(604) 594-1025 (Fax) Horizon@FocusAppliedTechnologies.com www.FocusAppliedTechnologies.com
Motorcycle Power Demand Coefficient of drag, Cd Coefficient of rolling resistance, Crr Page 4 of 29 frontal area vehicle mass rider and payload mass tire pressure
Parameters Affecting Fuel Consumption Factors Effects Motorcycle Condition Vehicle’s Emission Driving pattern Fuel Consumption Road Condition Operational Cost Environmental Condition Page 2 of 29
Motorcycle Driving Patterns Comparison Malaysia Aggressive acceleration/breaking Predominantly as commuters also as delivery and even in construction Very different “rules” from cars Lots of Motorcycle-only infrastructure West (US, Europe) More steady cruising with mild accelerations Mainly for leisure and occasionally for commuting Follow same rules as cars Page 39 of 32
Gear Ratio Effect: +/- 50% effect on FC Typical Seasoned Motorcycle Page 14 of 29