Download
1 / 12
120 likes | 214 Vues
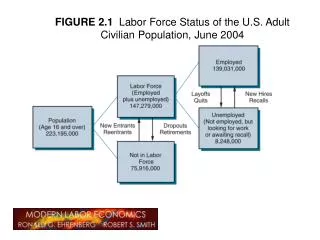
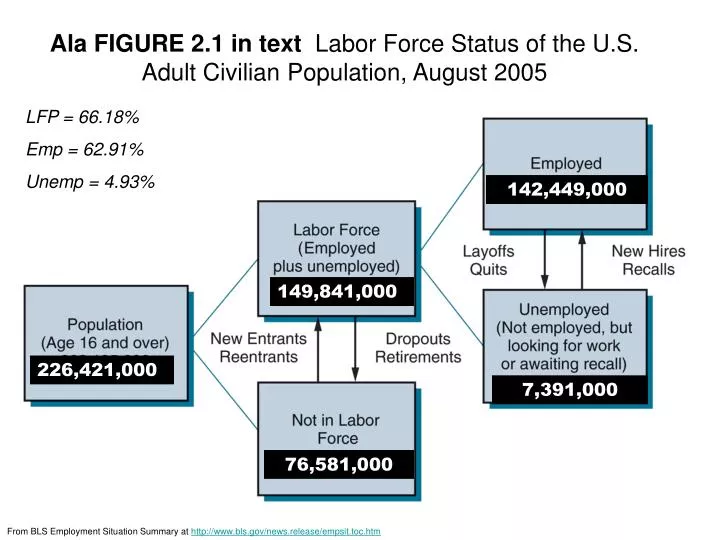
Ala FIGURE 2.1 in text Labor Force Status of the U.S. Adult Civilian Population, August 2005. LFP = 66.18% Emp = 62.91% Unemp = 4.93%. 142,449,000. 149,841,000. 226,421,000. 7,391,000. 76,581,000. From BLS Employment Situation Summary at http://www.bls.gov/news.release/empsit.toc.htm.

E N D
Ala FIGURE 2.1 in text Labor Force Status of the U.S. Adult Civilian Population, August 2005 LFP = 66.18% Emp = 62.91% Unemp = 4.93% 142,449,000 149,841,000 226,421,000 7,391,000 76,581,000 From BLS Employment Situation Summary at http://www.bls.gov/news.release/empsit.toc.htm
Ala FIGURE 2.2 Unemployment Rates for the Civilian Labor Force, 1900–200(5) 4.9% in 08/05
Ala Table 2.1 Labor Force Participation Rates by Gender, 1950–200(5)
Ala Figure 2.3 Employment Distribution by Major Industrial Sector, 1900-1997
Ala TABLE 2.2 Nominal and Real Hourly Earnings, U.S. Nonsupervisory Workers in the Private Sector, 1980–2004
TABLE 9.1 Changes in College Enrollments and Education Earnings Differential, by Gender, 1970–2001
TABLE 12.2 Female Earnings as a Percentage of Male Earnings, by Age and Education, Full-Time Workers, 2003
TABLE 12.4 Employment Ratios, LFP Rates, and Unemployment Rates, by Race and Gender,a 1970–2003
FIGURE 12.1 Mean Earnings as a % of White Male Earnings, Various Demographic Groups, FT Workers over 24 Years Old, 2003
Earnings of FT Full Year Workers, by Race and Gender, 1970-1999