Download
1 / 17
170 likes | 327 Vues
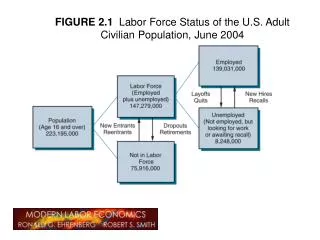
FIGURE 2.1 Labor Force Status of the U.S. Adult Civilian Population, June 2004. Labor Market Definitions. Population: Group that can voluntarily work Broadest definition: Civilian noninstitutional population aged 16 and over Population = In Labor Force + Not in Labor Force.

E N D
FIGURE 2.1 Labor Force Status of the U.S. Adult Civilian Population, June 2004
Labor Market Definitions Population: Group that can voluntarily work Broadest definition: Civilian noninstitutional population aged 16 and over Population = In Labor Force + Not in Labor Force
FIGURE 2.1 Labor Force Status of the U.S. Adult Civilian Population, June 2004 LF P Labor Force Participation Rate= (LF/P)*100 = (147/223)*100 = 66%
Labor Market Definitions Labor Force: Employed + unemployed Employed: worked at least 1 hour for pay; or 15 hours for family enterprise without pay; or Temporarily not at work for various personal reasons Unemployed: Not employed but actively seeking work
FIGURE 2.1 Labor Force Status of the U.S. Adult Civilian Population, June 2004 LF U Unemployment rate = (U/LF)*100 = (8.2/147.3)*100 = 5.6%
FIGURE 2.1 Labor Force Status of the U.S. Adult Civilian Population, June 2004 E P Employment rate = (E/P)*100 = (139/223.2)*100 = 62.3%%
Wage adjustments • Adjust slowly downward • Real wages rose in the Great Depression • White Collar workers in the 2001 Recession Adjust rapidly upward • Alaska pipeline • 1970s Coal boom Wall Street Journal, August 13, 2003
Alaskan Labor Market Carrington, William J. “The Alaskan Labor Market During the Pipeline Era.” Journal of Political Economy 104 (February 1996):186-218.
Alaskan Labor Market Carrington, William J. “The Alaskan Labor Market During the Pipeline Era.” Journal of Political Economy 104 (February 1996):186-218.
Alaskan Labor Market Carrington, William J. “The Alaskan Labor Market During the Pipeline Era.” Journal of Political Economy 104 (February 1996):186-218.
Alaskan Labor Market Carrington, William J. “The Alaskan Labor Market During the Pipeline Era.” Journal of Political Economy 104 (February 1996):186-218.
Black, Dan, Terra McKinnish and Seth Sanders. “The Economic Impact of the Coal Boom and Bust.” Economic Journal 115 (April 2005): 449-476.
Black, Dan, Terra McKinnish and Seth Sanders. “The Economic Impact of the Coal Boom and Bust.” Economic Journal 115 (April 2005): 449-476.
Black, Dan, Terra McKinnish and Seth Sanders. “The Economic Impact of the Coal Boom and Bust.” Economic Journal 115 (April 2005): 449-476.