Download
1 / 2
20 likes | 87 Vues
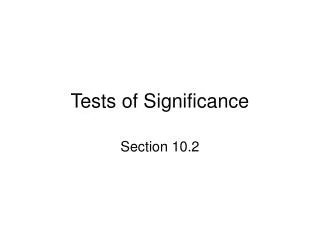
Bootstrapping generates 1000 trees which are broken into clusters. Probes are generated from sequences seen in any tree clusters and matched for significance. Refine probes based on high-scoring clusters. Determine probe significance threshold empirically. Tree sequences are divided into major clades for analysis.

E N D
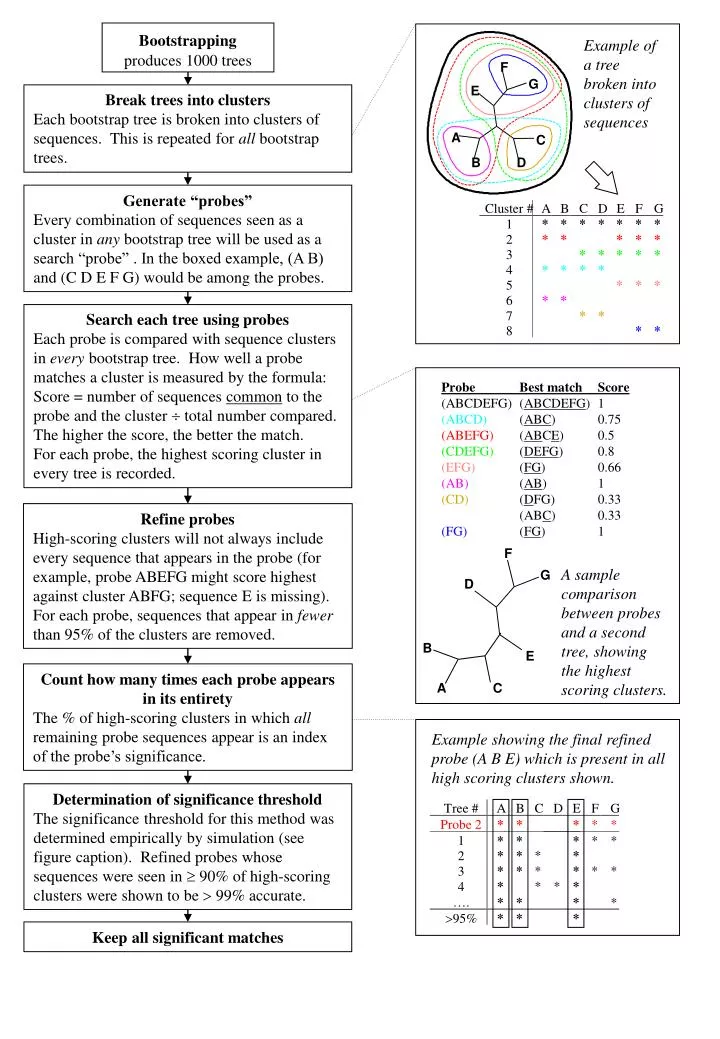
F G D B E A C Bootstrappingproduces 1000 trees Example of a tree broken into clusters of sequences F G E Break trees into clusters Each bootstrap tree is broken into clusters of sequences. This is repeated for all bootstrap trees. A C B D Generate “probes” Every combination of sequences seen as a cluster in any bootstrap tree will be used as a search “probe” . In the boxed example, (A B) and (C D E F G) would be among the probes. Cluster # A B C D E F G 1 * * * * * * * 2 * * * * * 3 * * * * * 4 * * * * 5 * * * 6 * * Search each tree using probes Each probe is compared with sequence clusters in every bootstrap tree. How well a probe matches a cluster is measured by the formula: Score = number of sequences common to the probe and the cluster total number compared. The higher the score, the better the match. For each probe, the highest scoring cluster in every tree is recorded. 7 * * 8 * * Probe Best match Score (ABCDEFG) (ABCDEFG) 1 (ABCD) (ABC) 0.75 (ABEFG) (ABCE) 0.5 (CDEFG) (DEFG) 0.8 (EFG) (FG) 0.66 (AB) (AB) 1 (CD) (DFG) 0.33 (ABC) 0.33 (FG) (FG) 1 Refine probes High-scoring clusters will not always include every sequence that appears in the probe (for example, probe ABEFG might score highest against cluster ABFG; sequence E is missing). For each probe, sequences that appear in fewer than 95% of the clusters are removed. A sample comparison between probes and a second tree, showing the highest scoring clusters. Count how many times each probe appears in its entirety The % of high-scoring clusters in which all remaining probe sequences appear is an index of the probe’s significance. Example showing the final refined probe (A B E) which is present in all high scoring clusters shown. Determination of significance threshold The significance threshold for this method was determined empirically by simulation (see figure caption). Refined probes whose sequences were seen in 90% of high-scoring clusters were shown to be 99% accurate. Tree # A B C D E F G Probe 2 * * * * * 1 * * * * * * * * * 2 * * * * * * 3 * * * * 4 …. * * * * 95% * * * Keep all significant matches
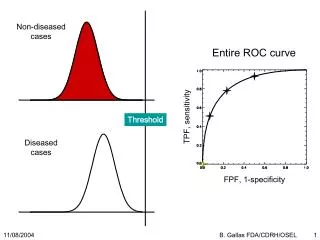
C D Slice Seq. H B G C A - - 86 14 D - 2 3 95 E 77 10 8 5 F 2 - 23 75 Slice Seq. H B G C A * D * E * F * Bootstrappingproduces 1000 trees H B G C E F Choose a set of major clades The choice depends on the specific phylogenetic question we wish to address. G H Example of a tree divided into subtrees Nominate one sequence to represent each clade One sequence from each major clade (e.g. plant, intracellular etc.) is selected. A B Distribution of the sequences A, D, E & F in the subtrees shown above Divide up the trees All bootstrap trees are divided into subtrees, each containing one of the nominated sequences. This division is unique. Measure the distribution of sequences in subtrees, among all bootstrap trees. Report sequence partitioning Where a sequence occurs in a defined portion of the tree (half of the subtrees or less) 95% of the time, this is reported. Those sequences which occur in a single slice are ignored, as these would have been identified using the comparison method. Final distribution of sequences in all bootstrap trees. For example, sequence A spends 86% of the time in subtree B, and 14% of the time in subtree G. The relationships in red will be reported; the one in blue would have been picked up already by the comparison method.