Download
1 / 52
520 likes | 642 Vues
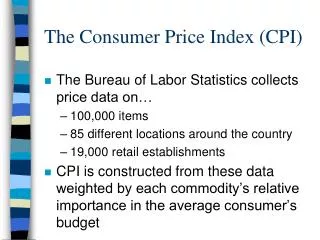
This presentation highlights recent enhancements and current challenges in the BLS Consumer Price Index (CPI) Program, including the modernization efforts, housing component updates, geographic sampling redesign, and the redesign of the Consumer Expenditure Survey. The discussion covers the importance of accurate price estimations, the impact on different demographic groups such as the elderly, measuring cost-of-living differentials across various regions, and the incorporation of new data collection methods. The presentation also addresses the challenges faced in improving preliminary estimates of the Chained CPI-U and explores strategies for continuous enhancement of the CPI program.

E N D
Recent improvements and current challenges in the BLS Consumer Price Index (CPI) Program Presentation to the Council of Professional Associations on Federal Statistics (COPAFS) December 3, 2010 Mike Horrigan Associate Commissioner Office of Prices and Living Conditions
Outline • CPI Modernization Effort • Housing • Geography • Redesign of the CPI estimation system • Redesign of the Consumer Expenditure (CE) Survey • The Telephone Point of Purchase Survey (TPOPS)
Outline • CPI-W and Social Security • CPIs for demographic groups (elderly) • Measuring cost of living differentials by geography (place-to-place comparisons) • Research on corporate and scanner data • Improving preliminary estimates of the Chained CPI-U
CPI Modernization • Goal is to move the remaining components of periodic CPI Revision (Housing and Geographic Sampling) to a continuous process • Housing (Rent Sample) will be converted first – beginning in 2010 • Geographic sampling will follow after incorporating 2010 Decennial results
Housing • Three Phases • Augmentation (2010 – 2011) • Increase sample of renters from 35,000 to 50,000 • Replacement (2012 – 2015) • Replace original 35,000 unit sample • Continuous Updating (2016 -- ) • Annually replace 1/6th of the full rent sample
Geographic • Two phases • 2010 Decennial sample • Use traditional approach where a new sample is drawn based on the decennial Census • Expectation that 67% are overlap with existing design • Remaining 33% replace existing areas that were not reselected • New areas are initiated into CPI over 4-6 years • TPOPS; CE; new Rent samples needed for new areas
Geographic • Post 2010 Decennial • Select new geographic areas from American Community Survey and Decennial Census • Rotate new areas into CPI design on an ongoing basis • TPOPS; CE and Rent sample required for each new area
New Estimation System • Oldest existing CPI production system • Outdated computer environment • Rigid structures and fixed data tables limit alternative item structures and formula • New system to take advantage of new computing environment • Flexibility with respect to Item structures and index estimation formula • Support researchers and index experimentation
Why redesign the CE? • Original design of the surveys - 1980s • Improvements in data collection such as CAPI, improved diary forms • Response rates a concern • Surveys are burdensome • Nature of how members of consuming units spend money has changed • Concerns over underreporting of expenditures
The CE redesign process • Survey Redesign Panel • Data capture forum • AAPOR panel on record use • Data users’ forum • Household survey producers workshop
The CE redesign process • Methodology workshop • Two independent contracts to outside survey houses to provide redesign options • CNSTAT consensus panel
The CE redesign philosophy • FY 2011 CE budget initiative • Marginal changes and thinking outside the box • Needs of the CPI • Cost weights • Item selection • TPOPS
The CE redesign philosophy • Interview of the future • Role of technology in data collection • Role of administrative data
The CE redesign philosophy • Cognitive methods to reduce burden and improve the quality of the estimates • Role of incentives • Proxy reporting • Use of global questions and matrix methods • Questionnaire order effects • Structured vs conversational interviewing • Recall period
TPOPS • Outlet Sample drawn from Telephone Point of Purchase Survey • Response rate is declining as households are better at screening unwanted calls • Potential biased results because “Cell Phone only” households are excluded • Latest estimates are 17-25% of all households • Younger households are even more likely to be cell phone only
TPOPS • Outlet sample frame replacement focuses on 3 approaches • Short run • Add Cell phone households to TPOPS • Planned start summer 2011
TPOPS • Long run • Examine use of administrative and corporate data as an alternative, examples: • Census of Retail Trade • Medical Expenditure Panel Survey • Examine alternative survey approaches to replace TPOPS: • Incorporate into Consumer Expenditure Survey • Mixed mode surveys for targeted demographics using mail, personal visit, and internet collection
Alternative approaches to estimating Cpi’s for demographic groups – example: the elderly
Estimating Price Indexes for demographic groups – the case of the elderly • Price indexes for a demographic group, for example, the elderly, require information on: • Where they make consumer purchases - TPOPS • What they purchase – CE and TPOPS • The ability to select items for pricing at each outlet – disaggregation • The disaggregation process is a key step • Selecting apples for pricing requires getting information on relative sales revenue by type of apple – from the store manager
Estimating Price Indexes for demographic groups – the case of the elderly • Asking a store manager to estimate revenue by type of product across all customers is difficult enough; • Asking them to estimate revenue by type of product for sales to a particular demographic group (say the elderly) is far more problematic. • Need to know which items you are selecting in advance of walking into the store (based on probability principles) with a minimum of further dissaggregation need in the outlet.
Estimating Price Indexes for demographic groups – the case of the elderly • Possible role of the redesigned CE survey • CE has demographics • Ask for outlet information • Ask for item purchase information
Data Collection • Vendors may be a source of alternative data, eliminating the burden on respondents and freeing economic assistants to focus on collecting hard-to-gather prices.
Checklist Evaluation • Disaggregation uses a checklist designed to identify the price determining characteristics of each item. • Compare the characteristics on the checklists with the characteristics found in other data sources.
Disaggregation Research • Disaggregation is the process of randomly selecting the specific item whose price will be collected over time. • Test the efficacy of disaggregation by examining the distribution of items in the CPI against other the distributions found in other data sources • Test the effect of “volume seller” selection as an alternative to disaggregation
Cost Weight Benchmark • The cost weights used in the CPI are derived from the interview and diary sections of the Consumer Expenditure Survey. • Compare the distribution of expenditures in the CE against the distribution found in other data sources
CPI Sample Benchmark • The CPI sample is the result of disaggregation in the outlets using checklists designed by the Commodity Analysts. • Compare the distribution of items selected for pricing using the CPI methodology to the distribution of items reported in the other data sources.
Biases • Various authors have identified potential biases in the CPI • Small sample bias • New and disappearing goods bias • Substitution bias • Weekday/weekend bias
New Indexes • New data offers the potential to explore new formulas or create new indexes: • Demographic Indexes (for food, at least) • New quality adjustment methods • Experimental disease based indexes
Measuring cost-of-living differentials (place-to-place comparisons)
The CPI and Substitution Bias • The CPI-U (Consumer Price Index for All Urban Consumers) is the “headline” CPI • It is a Lowe or “Modified Laspeyres” index, and does not reflect consumer substitution across item categories • BLS considers the C-CPI-U (Chained CPI-U) to be a closer approximation to a cost-of-living index
The Chained CPI-U • Uses a superlative Törnqvist formula requiring current spending as well as current price data • Preliminary C-CPI-U values are published monthly in “real time,” but only become final with a 1-2 year lag • In most years the preliminary indexes have underestimated the final C-CPI-U • Final indexes have been closer to the headline CPI-U than the preliminary indexes were
BLS Preliminary C-CPI-Us • Based on a geometric mean formula • BLS is evaluating three different methods for potential use in generating the preliminary indexes • Objective is to enhance the usefulness of the C-CPI-U by reducing revisions
Method 1. CES Model • Changes the formula used in the preliminary indexes • Headline CPI-U implicitly allows for no substitution; elasticity =0 • Overstates final C-CPI-U • Preliminary C-CPI-U indexes assume =1 • Understate final C-CPI-U • Constant-elasticity-of-substitution (CES) model can be used to estimate a substitution parameter 0 < < 1
Method 2. Predicted Expenditures • Changes the expenditure weights used in the preliminary indexes • Headline CPI-U implicitly assumes quantities purchased in a given item category are constant over time • Preliminary C-CPI-U indexes assume that spending shares remain constant • Seasonal adjustment (X-12 ARIMA) models can be used to predict the expenditure weights