Download
1 / 3
30 likes | 164 Vues
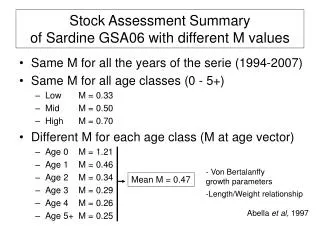
Stock Assessment Summary of Sardine GSA01 with different M values. Same M for all the years of the serie (2000-2007) Same M for all age classes (0 - 5+) Low M = 0.33 Mid M = 0.50 High M = 0.70 Different M for each age class (M at age vector) Age 0 M = 1.17 Age 1 M = 0.44 Age 2 M = 0.32

E N D
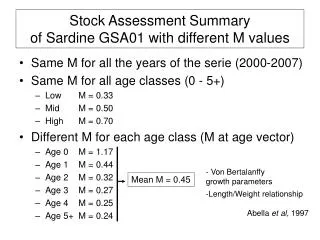
Stock Assessment Summaryof Sardine GSA01 with different M values • Same M for all the years of the serie (2000-2007) • Same M for all age classes (0 - 5+) • Low M = 0.33 • Mid M = 0.50 • High M = 0.70 • Different M for each age class (M at age vector) • Age 0 M = 1.17 • Age 1 M = 0.44 • Age 2 M = 0.32 • Age 3 M = 0.27 • Age 4 M = 0.25 • Age 5+ M = 0.24 • - Von Bertalanffy • growth parameters • Length/Weight relationship • Abella et al, 1997 Mean M = 0.45