P-values for different alternatives
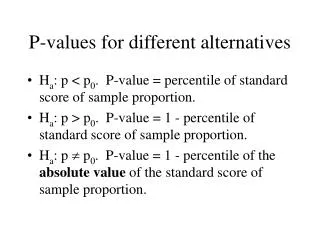
P-values for different alternatives. H a : p < p 0 . P-value = percentile of standard score of sample proportion. H a : p > p 0 . P-value = 1 - percentile of standard score of sample proportion.

P-values for different alternatives
E N D
Presentation Transcript
P-values for different alternatives • Ha: p < p0. P-value = percentile of standard score of sample proportion. • Ha: p > p0. P-value = 1 - percentile of standard score of sample proportion. • Ha: p p0. P-value = 1 - percentile of the absolute value of the standard score of sample proportion.
Manufacturing example • A company agrees to accept parts from a supplier as long as the proportion of defective parts in a shipment is not larger than 20%. • In a sample of 400 parts, the company finds that 100 are defective. • What should the company do?
Manufacturing example • H0: p = 0.2 and Ha: p > 0.2 where p represents the unknown proportion of defectives in the shipment. • Sample proportion = 100/400 = 0.25 • Distribution of sample proportion under the null is normal with a mean of 0.2 and std. dev. = 0.02. • Std. Score of 0.25 = (0.25 – 0.2)/0.02 = 2.5. • P-value = 1 – perc. of 2.5 = 1–0.9938 = 0.0062. • The company should reject the null and end the contract.
Buffon’s coin • Buffon wanted to do a significance test to see if his coin was fair. • H0: p = 0.5 and Ha: p 0.5 where p represents the proportion of heads one would get in an infinite number of tosses. • The reason for the alternative here is that if p is below or above 0.5 the coin is not fair.
Buffon’s coin • He tossed the coin 4040 times, and he got 2048 heads. • Sample proportion = 2048/4040 = 0.5069. • The distribution of the sample proportion under the null is normal with a mean of 0.5 and a std. dev. of 0.00787. • Standard score for 0.5069 = (0.5069 – 0.5)/0.00787 = 0.88. • P- value = 2*(1 – perc. of 0.88) = 2 * 0.19 = 0.38 • Fail to reject the null – No evidence the coin is unfair.