p-Values for Hypothesis Testing About With Known
120 likes | 473 Vues
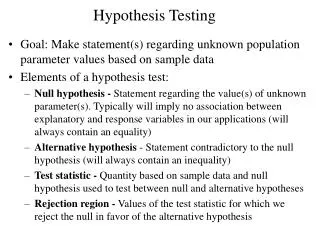
p-Values for Hypothesis Testing About With Known. Hypothesis Testing (Revisited). Five Step Procedure 1. Define Opposing Hypotheses. 2. Choose a level of risk ( ) for making the mistake of concluding something is true when its not. 3. Set up test (Define Rejection Region).

p-Values for Hypothesis Testing About With Known
E N D
Presentation Transcript
p-Values for Hypothesis Testing About With Known
Hypothesis Testing(Revisited) • Five Step Procedure 1. Define Opposing Hypotheses. 2. Choose a level of risk () for making the mistake of concluding something is true when its not. 3. Set up test (Define Rejection Region). 4. Take a random sample. 5. Calculate statistics and draw a conclusion.
p-Value The probability of getting an value at least as far away as the observed value, if H0 were true. Concept of a p-value • Ignore step 3 • Calculate
Alternate Hypothesisp-value “>” Area to the right of “<” Area to the left of “” 2* Area in the “tail” (to the right or left of ) Calculating p-Values • A p-value is a probability whose definition varies depending on the type of test we are doing (i.e. the form of the alternate hypothesis.)
p-value = p = 1-.9798 = .0202 25 p-value For “> Tests” = P(Getting a value greater than When H0 is true) H0: = 25 HA: > 25 = 4.2, n = 49 .9798 0Z 2.05 z = (26.23-25)/.6
p-value = p = .1003 27 p-value For “< Tests” = P(Getting a value less than When H0 is true) H0: = 27 HA: < 27 = 4.2, n = 49 0Z -1.28 z = (26.23-27)/.6
p-value = Area above 26.23 + Area below 25.77 = 2*Area above 26.23 p = 2(.3520) = .7040 .3520 .6480 .3520 26 .23 below 26 .23 above 26 p-value For “ Tests” = P(Getting a value at least as far away as When H0 is true) H0: = 26 HA: 26 = 4.2, n = 49 0Z .38 z = (26.23-26)/.6
P-VALUES AND α • Consider HA: > 25 • Here we got z = 2.05 • Since = .05, z.05 = 1.645 Can Accept HA • Suppose = .01; z.01 = 2.326 Cannot Accept HA • What about = .02? z.02 = 2.054 Cannot Accept HA • What about = .03? z.03 = 1.88 Can Accept HA • There is some value of that is the “break-point” between accepting and not accepting HA-- this is the p-value. If p α, Accept HA If p > α,Do Not Accept HA LOW p-values are SIGNIFICANT!!
=AVERAGE(A2:A50) =(C6-C3)/(C2/SQRT(49)) =1 – NORMSDIST(C7)
=AVERAGE(A2:A50) =(C6-C3)/(C2/SQRT(49)) =NORMSDIST(C7)
=AVERAGE(A2:A50) =(C6-C3)/(C2/SQRT(49)) =2*(1-NORMSDIST(C7)) Note: If z were negative, the p-value would have been: =2*NORMSDIST(C7)
REVIEW • p-values measure the strength of the test • lower p-values indicate more strongly that HA is true • p-values • “>” tests -- Area in upper tail (to the right of ) • “<” tests -- Area in lower tail (to the left of ) • “” tests -- twice the area in a “tail” • If z >0 -- twice the area in the upper tail • If z< 0 -- twice the area in the lower tail