P-Values
P-Values. Stephen Senn Competence Centre for Methodology and Statistics. Outline. Introduction to P_values History How they are defined and calculated What they are What they are not P-values as evidence? Distribution under null Distribution under alternative

P-Values
E N D
Presentation Transcript
P-Values Stephen Senn Competence Centre for Methodology and Statistics (c)Stephen Senn 2012
Outline • Introduction to P_values • History • How they are defined and calculated • What they are • What they are not • P-values as evidence? • Distribution under null • Distribution under alternative • Relevance or irrelevance of stopping rules • Some (further) controversies • Multiple endpoints • One sided versus two-sided tests • Reproduction probabilities • Two-trials rules and combining P-values (c)Stephen Senn 2012
What am I trying to do? • Good question! • It’s a big field that statisticians (and others) have been arguing about for nearly a century • All I am going to be able to do is touch on some issues (c)Stephen Senn 2012
Introduction to P-values History How they are defined and calculated What they are What they are not (c)Stephen Senn 2012
John Arbuthnot (1667-1753) An argument for divine providence, taken from the constant regularity observ’d in the births of both sexes. Male and Female christenings 1629-1710 in London showed an excess of males in every single one of 82 years. “This Equality of [adult] Males and Females is not the Effect of Chance but Divine Providence”*. Arbuthnot * Quoted by Anders Hald in his book, A History of Probability and Statistics. (c)Stephen Senn 2012
Arbuthnot’s Data (c)Stephen Senn 2012
Sex Ratio Christenings (c)Stephen Senn 2012
The Essence of Arbuthnot’s Argument • Suppose the null hypothesis is true • The pattern is a chance pattern • Calculate the probability of the result • This probability is very small • (1/2)82 (one tailed) • 2(1/2)82 = (1/2)81(two tailed) • Therefore we choose to reject the null hypothesis (c)Stephen Senn 2012
Daniel Bernoulli (1700-1782) • Nephew of James Bernoulli (1654-1705), a key figure in the history of probability • Early example of significance test (1734) • Planetary orbits appeared to be closely aligned • similar planes • Was this just chance? (c)Stephen Senn 2012
D Bernoulli’s Data Mercury 256' Venus 410' Earth 730' Mars 549' Jupiter 621' Saturn 558' (c)Stephen Senn 2012
D Bernoulli’s Test • Most extreme angle is 7º30’ • Probability of any planet having inclination 7º30’ = 7º30’/90 º= 1/12 • Probability of six planets with inclination 7º30’ = (1/12)6 = 1/2985984 • This result is therefore unlikely if chance is the explanation (c)Stephen Senn 2012
Common Features • A null hypothesis • No difference in probability of male or female birth • Alignment of planets is random • A test statistic • Number of years excess male births • Maximum angle of declination • The probability under the null hypothesis (c)Stephen Senn 2012
Difference Between the Two • Exact versus tail area • Arbuthnott: probability of most extreme case • Benoulli : probability of all cases as extreme or more extreme • Interpretation • Arbuthnott: P-value & likelihood & likelihood ratio • Bernoulli: P-value only (c)Stephen Senn 2012
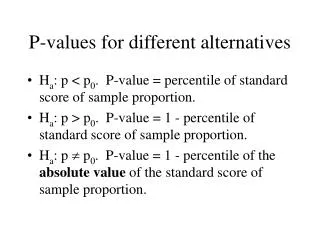
What are P-values? • They are a measure of unusualness of the data • The probability of a result as extreme or more extreme than that observed given that the null-hypothesis is true • This requires an agreed definition of what is more extreme (c)Stephen Senn 2012
Probability of results as extreme or more extreme than that observed = P-value (one-sided) Observed value of statistic (c)Stephen Senn 2012
What P-Values are not • They are not the probability that the null hypothesis is true • They are not (usually) the likelihood under the null hypothesis (c)Stephen Senn 2012
Warning! • A common fallacy is to think that the P-value is a statement about the probability of the hypothesis. • It is a statement about the probability of the data given the hypothesis. • Strictly speaking of the data plus more extreme data • Probability statements are not reversible • An example is given on the next slide (c)Stephen Senn 2012
The Prosecutor’s Fallacy • There is a one in a million probability of the DNA matching • Therefore there are 999,999 chances in a million that the the suspect is guilty. • Wrong • In a population of 300 million (as say in USA) there are 300 similar profiles. • Therefore we could make the same statement about 300 individuals (c)Stephen Senn 2012
The Mistake • The probability of the observed DNA profile given innocence is one thing. • The probability of innocence given the DNA profile is another. • They are not the same NB P-value is not the probability of the null hypothesis being true (c)Stephen Senn 2012
Invalid Inversion 'You might just as well say,' added the March Hare, 'that “I like what I get" is the same thing as "I get what I like"!' Lewis Caroll, Alice in Wonderland • Common fallacy • Known to philosophers as ‘the error of the transposed conditional’ • The probability of A given B is not the same as the probability of B given A (c)Stephen Senn 2012
A Simple Example • Most women do not suffer from breast cancer • It would be a mistake to conclude, however, that most breast cancer victims are not women • To do so would be to transpose the conditionals • This is an example of invalid inversion (c)Stephen Senn 2012
Some Plausible Figures Probability breast cancer given female = 550/31,418=0.018 Probability female given breast cancer =550/553=0.995 (c)Stephen Senn 2012
A Little Maths So invalid inversion is equivalent to a confusion of the marginal probabilities. The same joint probability is involved in the two conditional probabilities but different marginal probabilities are involved (c)Stephen Senn 2012
P-values as evidence? Distribution under null Distribution under alternative Relevance or irrelevance of stopping rules (c)Stephen Senn 2012
Sequential Trial Definition: A clinical trial in which the results are analysed at various intervals with the intention of stopping the trial when a 'conclusive result' has been reached. A stopping rule is usually defined in advance. In frequentist statistics the result of our analysis is a significance test (or hypothesis test). Now suppose that we propose to carry out a clinical trial in which we intend to study 500 patients at the most. However, after 250 patients have been studied we will carry out a significance test to see if the treatment is ‘already significant’. If it is we will stop. Now if we use conventional ‘fixed sample size techniques’ to examine ‘significance’ we shall claim significance rather more often than if we had run a fixed sample size trial, even when the null hypothesis is true. (c)Stephen Senn 2012
Illustration of ‘alpha inflation’ Circumstances under which fixed and sequentially run trials would achieve significance if there were no adjustment for multiple testing. It is assumed that 500 patients are studied if the trial runs to completion but that one looks after 250 (c)Stephen Senn 2012
Moral • Other things being equal, the chance of declaring a significant result is higher if we analyse sequentially • Therefore we should use more stringent significance levels • Or, equivalently, adjust our P-values upwards • Or should we…….? (c)Stephen Senn 2012
ExampleA Theoretical Problem? • Is there a bias in meta-analysing trials that have themselves been run sequentially? • Example on the next slide • Single look • No adjustment for repeated testing • Information fraction at look varies in steps of 0.01 from 0.01 to 0.99 • Treatment effect is 1 • Standard error for full information fraction of 1 is 1 (c)Stephen Senn 2012
Simple proof? • We can provide a general proof • The lines go like this • Trials that stop early will overestimate the treatment effect • Trials that don’t step early will have an early part corresponding to stopped trials that underestimates the treatment effect • Provided that these two parts are added together in the proportion in which they arise there can be no bias • This involves weighting trials as a whole according to information provided (c)Stephen Senn 2012
Some (further) controversies Multiple endpoints One sided versus two-sided tests Reproduction probabilities Two-trials rules and combining P-values (c)Stephen Senn 2012
Multiple endpoints • If you carry out many statistical tests then (unless they are all perfectly concordant) the probability that at least one is significant is greater than the probability that any one is • Hence the probabity of rejecting at least one null hypothesis is greater than the probability of rejecting any given null hypothesis • This suggests that the P-value for the tests as a family should not be the minimum (naïve) P-value • Hence ifyou are going to judge significance for the family by using the lowest P-value, the individual P-values should be adjusted upwards (c)Stephen Senn 2012
Types of multiplicity • Multiple treatments • Many doses • Gold standard trials • Sequential testing • Multiple outcomes The first and second usually provide cases of (approximately) known structural correlation: for example 0.5 for various treatments v placebo in the case of multiple treatments The third is (in principle) unstructured and the correlations are not known Simplest common approach in the third case is the Bonferroni correction Multiply each P-value by the number of tests (c)Stephen Senn 2012
Types of Power • Individual power = probability to reject an individual (specific) false hypothesis • Disjunctive* power = probability to reject at least one false hypothesis • Conjunctive* power = probability to reject all false hypotheses • Average power = average proportion of rejected false hypotheses • These have also been referred to as minimal and maximal power respectively but caution, in that case minimalpower is greater than maximalpower (c)Stephen Senn 2012
BonferroniBasic Considerations • Protects you against worst possible configuration of correlation matrix • Is conservative • Therefore the individual power is lower • However, the disjunctive power may well be higher • Of course the conjunctive power is lower (c)Stephen Senn 2012
Compound Symmetry for Standardised Variable Of course, this is not very realistic. It is just being used as a simple example to get some sort of impression of the effect of correlation on power. (c)Stephen Senn 2012
Theoretical advantage Where we have compound symmetry we can use a single latent variable (effectively the first principle component) and consider the conditional distribution of all other variables given this latent variable. The other variables are, in fact, conditionally independent given this latent variable and this considerably eases the calculation of various error rates (c)Stephen Senn 2012
Disjunctive power The case shows 80% power for a single outcome for a 5% type I error rate two-sided It is assumed that the non-centrality parameter is the same for all variables (c)Stephen Senn 2012
Conjunctive power The case shows 80% power for a single outcome for a 5% type I error rate two-sided It is assumed that the non-centrality parameter is the same for all variables (c)Stephen Senn 2012
One sided or two-sided tests? • Should we carry out one sided or two sided significance tests? • The latter require us to consider departures from the null in both directions • This suggests that the P-value should be doubled • This simple issue has attracted a huge amount of controversy (c)Stephen Senn 2012
Since superiority cannot be excluded we must use two-sided tests Because our test situation is not to choose between H0 : = 0 H1: > 0 but between H0 : = 0 H1: 0 we must have two-sided tests (c)Stephen Senn 2012
Because we would never register an inferior drug we can use one-sided tests According to this point of view in reality our task is to choose between H0: 0 H1: > 0. A one sided test of size for = 0 will have type one error < for any other value of in H0, therefore there is no need to have a two-sided test. (c)Stephen Senn 2012
Label Invariance Requires us to Use Two-Sided Tests The advantage of a two-sided test is that it is ‘label invariant’. We can reverse the labels of the drugs and come to the same conclusion. (c)Stephen Senn 2012
If we use Two-Sided Tests we Cannot Conclude Superiority This is just silly. It is based on the premise that a two sided test implies that we have H0 : = 0 and H1 : 0. Rejection of H0 implies that the non-directional H1 only can be asserted. However we could equally well write H0 : = 0 and H1a : > 0. H0 : = 0 and H1b : < 0. Now if we test H0 twice, once against each of these two alternative hypotheses, our overall type one error rate will be maintained at provided each test is carried out at size /2. (c)Stephen Senn 2012
We Have Used Two-Sided Tests in the Past and Must Continue to do So Whatever standard we use is arbitrary. The important thing is to be consistent. Whether you regard standard tests as being two-sided at the 5% level or one-sided at the 2.5% level is irrelevant: either way we must continue to do as we did. (c)Stephen Senn 2012