P Values - part 3 The P value as a ‘statistic’
130 likes | 318 Vues
P Values - part 3 The P value as a ‘statistic’. Robin Beaumont 1/03/2012 With much help from Professor Geoff Cumming. probability. P values - Putting it all together. P Value. sampling. Alternatives. statistic. Rule. Review. Summary so far.

P Values - part 3 The P value as a ‘statistic’
E N D
Presentation Transcript
P Values - part 3The P value as a ‘statistic’ Robin Beaumont 1/03/2012 With much help from Professor Geoff Cumming
probability P values - Putting it all together P Value sampling Alternatives statistic Rule
Review Summary so far • A P value is a conditional probability which considers a range of outcomes – shown as a ‘area’ in a graph. • The SEM formula allows us to: predict the accuracy of your estimate ( i.e. the mean value of our sample) across a infinite number of samples!
What is a statistic? Summary so far • A statistic is just a summary measure, technically we have reduced a set of data to one or two values: • Range (smallest – largest) • Mean, median etc. • Inter-quartile range, SD Variance • Z score, T value, chi square value, F value etc • P value
T value • T statistic – different types, simplest 1 sample: So when t = 0 means 0/anything = estimated and hypothesised population mean are equal So when t = 1 observed different same as SEM So when t = 10 observed different much greater than SEM
T statistic example Serum amylase values from a random sample of 15 apparently healthy subjects. The mean = 96 SD= 35 units/100 ml. How likely would such a ‘unusual’ sample be obtained from a population of serum amylase determinations with a mean of 120. (taken from Daniel 1991 p.202 adapted) The population value = the null hypothesis This looks like a rare occurrence?
9.037 n =15 t density: s = x 96 Original units: 120 Shaded area=0.0188 0 2.656 0 -2.656 t Given that the sample was obtained from a population with a mean of 120 a sample with a T(n=15) statistic of -2.656 or 2.656 or one more extreme will occur 1.8% of the time = just under two samples per hundred on average. . . . . Given that the sample was obtained from a population with a mean of 120 a sample of 15 producing a mean of 96 (120-x where x=24) or 144 (120+x where x=24) or one more extreme will occur 1.8% of the time, that is just under two samples per hundred on average. What does the shaded area mean! Serum amylase values from a random sample of 15 apparently healthy subjects. mean =96 SD= 35 units/100 ml. How likely would such a unusual sample be obtained from a population of serum amylase determinations with a mean of 120. (taken from Daniel 1991 p.202 adapted) =P value P value= 2 · P(t(n−1) < t| Ho is true) = 2 · [area to the left of t under a t distribution with df= n − 1]
P value and probability for the one sample t statistic p value = 2 x P(t(n-1) values more extreme than obtained t(n-1) | Ho is true) = 2 X [area to the left of t under a t distribution with n − 1 shape] Statistic -> sampling distribution -> PDF -> p value No sampling distribution! Create a virtual one
P Value Variability Taking another random sample the P value be different How different? – Does not follow a normal distribution Depends upon the probability of the null hypothesis being true! Remember we have assumed so far that the null hypothesis is true. Dance of the p values – Geoff Cummings
Simplified dance of the p values when the null hypothesis is true Example from Geoff Cummings dance of the p values The take home message is that we can obtain very small p values even when the null hypothesis is true.
Why no CI for the P Value if it varies across trials • P value -> statistic but • Not all statistics represent values that are reflected in a population value • Other ways of getting an idea of variability across trials: • Reproducibility Probability Value (RP) Goodman 1992 and also 2001 journal articles Hung, O’Neill, Bauer & Kohne 1997 Biometrics journal Shao & Chow 2002 – Statistics in Medicine journal Boos & Stefanki 2011 – Journal of the American statistical association Cummings 2008 + and book
Cumming’s Reproducibility (replication) Probability Value Given Pobtained= 0.05 What is the interval in which we are likely to see 80% of subsequent P values? Answer: We have 80% of seeing subsequent p values fall within the zero to 0.22 boundary 0, 0.22 [One sided] This means that we have a 20% of them being subsequently > 0.22
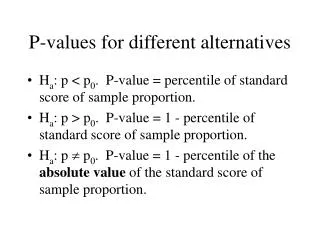
P Value What about when the null hypothesis is not true? Rule statistic Alternatives