Molecular Phylogenetics
Molecular Phylogenetics. Phylogenetic trees are about visualizing evolutionary relationships. “Nothing in Biology Makes Sense Except in the Light of Evolution” Theodosius Dobzhansky (1900-1975). Phylogeny. Hypothesis of evolutionary relationships

Molecular Phylogenetics
E N D
Presentation Transcript
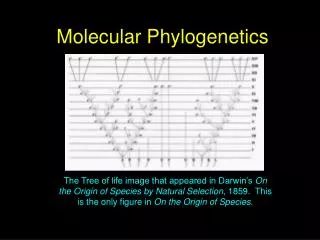
Phylogenetic trees are about visualizing evolutionary relationships “Nothing in Biology Makes Sense Except in the Light of Evolution” Theodosius Dobzhansky (1900-1975)
Phylogeny • Hypothesis of evolutionary relationships • Phylogenetic tree = graphical summary of evolutionary history • We have been using trees throughout the semester • Now we will examine how to construct them • Phylogeny is only an estimate
Phylogenetics • Under Darwin’s hypothesis of common descent Species in the same genus stem from a recent ancestor • Hierarchical classification reflects not a mystical ordering of the universe, but rather a real historical process
Phylogenies • Species tree (how are my species related?) • contains only one representative from each species • when did speciation take place? • all nodes indicate speciation events • Gene tree (how are my genes related?) • normally contains a number of genes from a single species • nodes relate either to speciation or gene duplication events
Phylogenetic Trees • Diagram consisting of branches and nodes A B C D E terminal node interior node split (bipartition) also written AB|CDE or portrayed **--- branch (edge) root of tree
Rooting a Phylogeny • Several methods used to identify polarity • Most commonly used is the outgroup method • The character state of the target taxa is compared with that of a relative that diverged earlier • Outgroup represents the ancestral state • Identify outgroup from other phylogenetic studies or fossil data • Good to use several outgroups at once
Rooting Using an Outgroup • The outgroup should be a sequence (or set of sequences or taxon) known to be less closely related to the rest of the sequences (taxa) than they are to each other 2. It should ideally be as closely related as possible to the rest of the sequences (taxa) while still satisfying condition 1 The root must be somewhere between the outgroup and the rest (either on the node or in a branch) The POINT of rooting (using an outgroup) is to include the ancestor of the group of interest in the phylogeny!
Terms • Clade: A set of species (or sequences) which includes all of the species (or sequences) derived from a single common ancestor • Monophyly • Polyphyly • Paraphyly
Cladograms VS. Phylograms • Cladogram • Only shows you the relationships between taxa • Branch lengths provide no data! • Phylogram • Shows you relationships AND the amount of change (evolution) inferred along each branch • Therefore, branch lengths are very important!
Phylogram [sometimes Phenogram] (branch lengths mean something)
Cladograms VS. Phylograms Species A Species A Species B Species B Species C Species C Species D Species D Species E Species E Species F Species F 5 changes
Phylogenetics Terms • Monophyletic Group • All members are believed to stem from a single common ancestor, and the group includes this common ancestor • Paraphyletic Group • Group that is monophyletic except that some descendents of the common ancestor have been removed • Polyphyletic Group • consisting of unrelated lineages, each more closely related to other lineages not placed in the taxon
Cladistic Methods • Techniques that identify monophyletic groups based on synapomorphies • Synapomorphies define evolutionary branching points • Autapomorphies and ancestral characters do not • Must be able to identify homology of traits and direction of change through time (Polarization)
Homology • The features of organisms almost always evolve from pre-existing features of their ancestors • Unlikely that features arise de novo from nothing…
Homology • Homologous features are derived from a common ancestor • Organs of 2 organisms are homologous if they have been inherited (& perhaps modified) from a single organ of a common ancestor • A character may be homologous among species but a character state may not • 5 toed state is homologous in humans and lizards but the 3 toed state is not homologous in Guinea pigs and Sloths • The wings of birds and those of bats are not homologous, although their forelimbs in general are homologous structures (convergent evolution)
Maximum Parsimony (Cladistic) Occam’s Razor Entia non sunt multiplicanda praeter necessitatem. William of Occam (1300-1349) The best tree is the one which requires the least number of substitutions
Parsimony and Phylogeny • Most closely related taxa should have the most traits in common • Assume that traits are independent, heritable, and variable in target taxa • Traits may be DNA sequence, presence or absence of skeletal elements or floral parts, mode of embryonic development, etc. • Traits scored in different taxa must be homologous
Parsimony and Phylogeny • Shared derived characters (ONLY) are used to deduce the branching patterns of the tree • Synapomorphy • Synapomorphies are used to attach two branches at a NODE on the tree
Parsimony and Phylogeny • Traits may revert to ancestral form because of mutation or selection • This may destroy phylogenetic signal and lead to reconstruction of misleading relationships • Reversal • Convergence and Reversal and collectively known as Homoplasy
Parsimony and Phylogeny • Homoplasy • Creates noise in the data • Some characters give conflicting information about relationships • Systematists try to minimize homoplasy in a data set • Choose characters that evolve slowly relative to age of taxa
Parsimony and Phylogeny • Parsimony minimizes total amount of evolutionary change in a tree • Synapomorphies are usually more common than convergence and reversal • Most parsimonious trees minimize homoplasy to give best estimate of phylogeny
Fitch (equal-weighted) parsimony Data for site 1 shown on tree topology for all 16 possible combinations of states at the 2 interior nodes. Character length is 2 for this site.
A A A C B B C B D D D C 237 241 225 (best) (worst) Tree length (or tree score) Total steps = 2 + 1 + 2 + 2 + . . . + 1 = 237 Character length from site 1 Character length from site 2 This value is used to compare this tree topology to other tree topologies (smaller is better)
Phylogenetic Characters • Which characters should be used to reconstruct the correct phylogeny? • Morphological characters • ie, Skeleton • For fossils only morphological characters can be used • Morphological characters difficult to use because taxonomic expert needed • Molecular characters • Allozymes, RFLPs, DNA sequences • MUST CHOOSE MOLECULAR MARKER THAT IS APPROPRIATE • Best molecular marker is one which has plenty of variation (=phylogenetic signal) yet not too much homoplasy (not too variable!).
Phylogenetic Characters • Which characters should be used to reconstruct the phylogeny? • Molecular data has the advantage that they can be rapidly collected and scored • However, homoplasy difficult to indentify • Only four bases: G, A, T, C • Multiple types of data (including multiple gene sequences) often the best
What sequences should I use for organism phylogenies? • Slowly evolving / Fast evolving • rRNA • mitochondrion • Nuclear • chloroplast
Other Phylogenetic methods Parsimony is not the only method for estimating phylogenetic relationships!…
Some pitfalls of Parsimony… • It can take quite a long time to compute a Parsimony estimate of a phylogeny… • Also, parsimony may be very error prone when: • rates of evolution are variable • very divergent species (or OTUs) are compares because it does not deal well with accounting for homoplasy…
Other Phylogenetic methods • Other reconstruction methods • Distance (Phenetic) methods • e.g.: Neighbor joining and UPGMA • Based on clustering technique • Based on overall similarity • Not a cladistic method • Uses differences (distances) among character states to group taxa
Using Distance Methods to Reconstruct Phylogenetic Relationships Species with the LEAST genetic distance (or other distance) between them are assumed to be CLOSE relatives However, there are MANY cases where this may NOT be true!
Distance-Based Methods (UPGMA, Neighbor Joining, etc..) • Distance methods are typically very very fast and easy to use to estimate a phylogenetic tree • However, they are not cladistic because they do not look for synapomorphies, but rather overall similarity… • This means this method is also susceptible to lots of error when a dataset has lots of homoplasy…
Distance methods • Normally fast and simple • e.g. UPGMA, Neighbour Joining, Minimum Evolution, Fitch-Margoliash
Correction for multiple hits • Only differences can be observed directly – not distances • All distance methods rely (crucially) on this • A great many models used for nucleotide sequences (e.g. JC, K2P, HKY, Rev, Maximum Likelihood) • AA sequences are infinitely more complicated! • Accuracy falls off drastically for highly divergent sequences
Distance methods Attempts to account for multiple hits using models in distance methods (observed vs. estimated amount of evol. distance)
Other Phylogenetic methods • Maximum likelihood assumes a particular model of sequence evolution and calculates how likely each branch arose based on the character data • Uses all data, even autapomorphies and invariant sites • Uses models of evolution designed to capture a pattern of change across characters (e.g., DNA) • Allows us to account for complex patterns of nucleotide evolution across regions of genes that may evolve very differently (thus, not all types of changes are weighted evenly in determining the phylogeny…) Lets look at an example… although we will save more heated discussions of patterns for Bayesian MCMCMC methods….
Within vs. Between Gene Variation Transversions 1.8 Gene 1 Gene 2 C-G Relative Rate of Substitution (G-T = 1) A-C A-T 0 Length Along Genome
Maximum Likelihood Methods • Likelihood methods are among the most accurate methods to reconstruct phylogenies! • However, they are VERY VERY computationally intensive a tree with 30 species may take several days, with 100 species may take several months! • New likelihood methods employing Bayesian statistics along with Marcov Chain Monte Carlo algorithms are helping to solve this problem and are the cutting edge of phylogeny reconstruction these days…
Likelihood Methods • Requires a model of evolution • Each substitution has an associated likelihood given a branch of a certain length • A function is derived to represent the likelihood of the data given the tree, branch-lengths and additional parameter • So, the tree we get from ML is “the phylogeny that is most likely to have produced the observed data (under the model of evolution selected)”
The Likelihood Criterion Given two trees, the one maximizing the probability of the observed data is best • Site likelihood - probability of the data for one site conditional on the assumed model of evolution • Tree score - sum of site log-likelihoods (term score also general term for the derivative of the lnL) • Unlike parsimony tree lengths, log-likelihoods are comparable across models as well as trees
Models can be made more parameter rich to increase their realism • The most common additional parameters are: • A correction to allow different substitution rates for each type of nucleotide change • A correction for the proportion of sites which are unable to change • A correction for variable site rates at those sites which can change • The values of the additional parameters will be estimated in the process (e.g. PAUP)
A gamma distribution can be used to model site rate heterogeneity
Long Branches Attract In a set of sequences evolving at different rates the sequences evolving rapidly are drawn together Distance methods are VERY VERY prone to making this error Parsimony is also prone to this error Likelihood methods employ an ‘informed’ view of character change (a model) which helps identify situations which probably represent homoplasy, thus decreasing LBA
Phylogenetic Methods… • It is useful to use a variety of tree reconstruction methods • If methods are congruent you have more confidence in your reconstructions!