Download
1 / 18
180 likes | 339 Vues
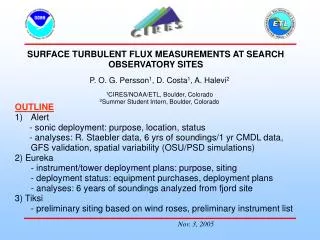
SURFACE TURBULENT FLUX MEASUREMENTS AT SEARCH OBSERVATORY SITES. P. O. G. Persson 1 , D. Costa 1 , A. Halevi 2 1 CIRES/NOAA/ETL, Boulder, Colorado 2 Summer Student Intern, Boulder, Colorado. OUTLINE Alert - sonic deployment: purpose, location, status

E N D
SURFACE TURBULENT FLUX MEASUREMENTS AT SEARCH OBSERVATORY SITES P. O. G. Persson1, D. Costa1, A. Halevi2 1CIRES/NOAA/ETL, Boulder, Colorado 2Summer Student Intern, Boulder, Colorado • OUTLINE • Alert • - sonic deployment: purpose, location, status • - analyses: R. Staebler data, 6 yrs of soundings/1 yr CMDL data, GFS validation, spatial variability (OSU/PSD simulations) • 2) Eureka • - instrument/tower deployment plans: purpose, siting • - deployment status: equipment purchases, deployment plans • - analyses: 6 years of soundings analyzed from fjord site • 3) Tiksi • - preliminary siting based on wind roses, preliminary instrument list
Purpose: obtain turbulent sensible (& latent) heat fluxes to complement CMDL radiation measurements - validate/improve Arctic bulk flux parameterizations - complete SEB 2 ATI sonics with heaters & heater controllers delivered 11/3/05 DAS being finalized with heater control Sonics, DAS, mounting to be tested at BAO/Niwot Ridge during Nov-Dec Deployment to Alert ASAP after testing (January?) Alert Sonic Deployment CMDL Main Platform
1) analyze previous turbulent flux measurements (R. Staebler) 2) physical processes given by CMDL measurements (since 8/04) & sounding data (have 1/99-12/04 – hope to get 2005). 3) do 1 year SEB estimates from CMDL measurements with bulk flux parameterizations 4) GFS (NCEPs global model) validation 5) spatial variability of airflow, clouds, SEB using a) 2 years of MM5 simulations (D=54,18, 6 km; nz=32; I.C. 00 UTC AVN; 36-h fcst) by OSU (R. Samuelson) and b) own MM5/WRF simulation at D=1 km Alert Analyses
Alert Analysis - GFS Validation Tair, Wind Speed, Psfc 12/18/04 – 5/3/05 BIAS RMSE CORR
Alert Analysis - GFS Validation 12/18/04 – 5/3/05 LWd, LWup RMSE BIAS CORR
Alert Analysis – Spatial Variability with MM5 54 km COAS at Oregon State Univ. P. Barbour and R. Samuelson D=54,18, 6 (151X88), 2 km; nz=32; I.C. 00 UTC AVN; 36-h fcst 18 km 6 km 2 km http://www-hce.coas.oregonstate.edu/~cmet/nares/
Alert Analysis – Spatial Variability with MM5 D=6 km D=18 km IC: 00Z Nov3_05 D=54 km A A t = 0 h E t = 36 h
Alert Analysis – Spatial Variability with MM5 D=54 km IC: 00Z Nov6_05 D=6 km D=18 km t = 0 h A A E t = 36 h
Alert Analysis – Spatial Variability with MM5 D=54 km IC: 00Z Nov7_05 D=6 km D=18 km t = 0 h A A E t = 36 h
Alert Analysis – Spatial Variability with MM5 D=54 km IC: 00Z Nov8_05 D=6 km D=18 km t = 0 h A A E t = 36 h
Alert Analysis – Spatial Variability with MM5 . . MM5 Monthly Mean 10-m Winds 01/2005 08/2004
Eureka (Ellsemere Island, Canada) Area Note possibility of unobstructed NNW-S airflow between 1-2 km along Eureka Sound & Nansen Sound • Eureka is in: • Polar region (80° N, 86° W) • a small fjord branching from larger fjords, 200 km from Arctic Ocean • c) region of complex terrain (terrain elevation > 1500 m within 150 km to W and NNE through SSE)
1) town site at river mouth to fjord at 10 m elevation 2) airstrip 2 km away at 80 m elevation 3) Slidre Fjord is oriented 110°-290° 4) An 8 km-wide valley is to the NNE with valley floor at 150-200 m 5) Ridges to NW and ENE reach 600-800 m at 8-10 km distance N Eureka Area- small scale
Measurements: Motivations/Objectives • Surface Energy Budget • integrates effects of processes crucial for determining exchange between • surface and atmosphere • - e.g., net effects of clouds on surface • monitor effects of long-term (climate) changes in atmosphere • includes radiative, turbulent, and conductive fluxes Surface Energy Budget (SEB) : Ftot = Qsi - Qso + Qli - Qlo- Hs - Hl + C Ftot= net surface energy flux Qsi, Qso, Qli,and Qlo - incoming/outgoing shortwave/longwave radiative fluxes Hs, Hl - turbulent sensible/ latent heat fluxes C - conductive flux • Turbulent Fluxes (Hs, Hl) • - important component of SEB • bulk flux algorithms used in climate models need to be tested with data in • representative but poorly-sampled environments