Download
1 / 14
140 likes | 279 Vues
GEOSummit Baseline Measurements (Greenland Environmental Observatory at Summit). Joe McConnell 1 , Ryan Banta 1 , Tom Cahill 2 , J. Burkhart 3 , and Roger Bales 3 1 Desert Research Institute, Reno, NV, USA 2 University of California, Davis, USA 3 University of California, Merced, USA

E N D
GEOSummit Baseline Measurements(Greenland Environmental Observatory at Summit) Joe McConnell1, Ryan Banta1, Tom Cahill2, J. Burkhart3, and Roger Bales3 1Desert Research Institute, Reno, NV, USA 2University of California, Davis, USA 3University of California, Merced, USA AON PI Annual Meeting, Boulder, CO 2007
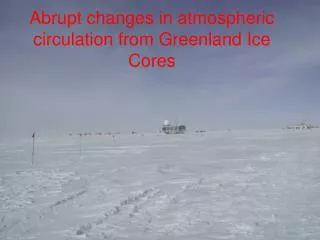
Summit Camp Why GEOSummit? • Summit is a unique site • Ideal location to study remote troposphere, hydrology, and further understand significance of deep ice core records • long range transport is implicit • reflect atmosphere and snow conditions representative of regional to hemispheric-scale processes • only high elevation mid-troposphere station in northern high latitudes • co-located research including snow-atmosphere chemical transfer studies, long term climate records from deep ice cores, etc. • Year round measurements beginning 2000-2002 • GEOSummit established 2003-2008
Na Mg Ca Mn Rb Sr Concentration (ppb) Al S Pb Surface SnowMeasurements • Elemental analysis performed using an ICP-MS in a class 100 clean room Surface Snow Sampling
Na Mg Ca Mn Rb Sr Concentration (ppb) Al S Pb Surface Snow Measurements • Exhibits periods where many elemental concentrations co-vary • Likely due to similar source areas and/or transport processes • For example, spring peaks
Na Mg Ca Mn Rb Sr Concentration (ppb) Al S Pb Surface Snow Trace Elements- pollution signals • Periods of elevated S and Pb concentrations - possible pollution tracers • Associated with less significant increases in: - Na (sea salt tracer) - Al (dust tracer)
Na Mg Ca Mn Rb Sr Concentration (ppb) Al S Pb Surface Snow Trace Elements- marine sources • Periods of elevated S and Na concentrations - other elemental concentrations are not elevated - possible marine sources
Aerosol Measurements • Drum impactor measures amount and composition for 8 stages (sizes) • Continuously collects samples every 6 to 24 hours • Data from May 2003 - present
Aerosol Size Fractionation • Dominant size fractions of aerosols are the smaller bins (0.34 to 0.75 um) • Fine aerosols uncorrelated with coarse aerosols
Aerosol Characteristics • First spring sulfur peak is from USA • Second sulfur peak is from Asia (cross polar trajectories)
Data Storage and Dissemination • Currently stored as flat files (.txt) with associated ReadMe metafiles • Made available to the public as soon as QA/QC processes are complete and/or presented in publications • Expand current and future collaborations with several institutions already in progress • Archived at www.geosummit.org
Thank you www.geosummit.org